

Database upgrades are often a source of “performance anxiety.” Even with extensive testing, the gap between a sterile staging environment and the chaotic reality of production—characterized by shifting SQL parameters, bursty concurrency, and complex execution contexts—often leads to unexpected post-upgrade regressions.
Traffic Replay on TiDB Cloud, an internal-only tool currently in development for a wider release, bridges this gap. It allows you to upgrade with production-fidelity confidence by catching execution plan regressions and performance “cliffs” before they ever reach your users.
Key Terminology:
- CPS (Commands Per Second): The volume of SQL commands executed per second. Replay fidelity is measured by how closely the test CPS matches the production curve.
- Prepared Statements & Plan Cache: By preserving statement IDs to 1:1 simulate prepared statements, we ensure Plan Cache efficiency is accurately modeled.
- 99% Accuracy: The statistical correlation between production and replay traffic in CPS shape and query mix.
The Problem with Traditional Database Testing
Common synthetic benchmarking (client-side simulation) often fails to reflect actual production pressure. Traffic Replay addresses these specific “fidelity gaps”:
| Feature | Synthetic Simulation (Traditional) | Traffic Replay (TiDB Cloud) |
| Load Patterns | Static: Relies on fixed scripts or simple randomization. | Dynamic: Captures mixed request types and fluctuating frequencies. |
| Data Distribution | Uniform: Often misses hotspots or data skewness. | Authentic: Validates cache and indexing under real-world data skew. |
| Concurrency | Fixed: Linear or static concurrency models. | Real-world: Replicates bursts and interrelated session states. |
| Execution Context | Oversimplified: Often misses session variables or Plan Cache state. | High Fidelity: 1:1 mapping of connections and prepared statements. |
When Should You Use TiDB Cloud Traffic Replay?
If your application meets any of the following criteria, Traffic Replay should be a mandatory step in your maintenance lifecycle:
- Major Version Upgrades: Moving across significant architectural changes (e.g., TiDB 6.x to 8.x).
- Optimizer Changes: When enabling new features like optimizer enhancements.
- High P99/P999 Sensitivity: For latency-critical applications where even a 5ms regression is unacceptable.
- Workload Volatility: For systems with highly bursty traffic or complex query patterns.
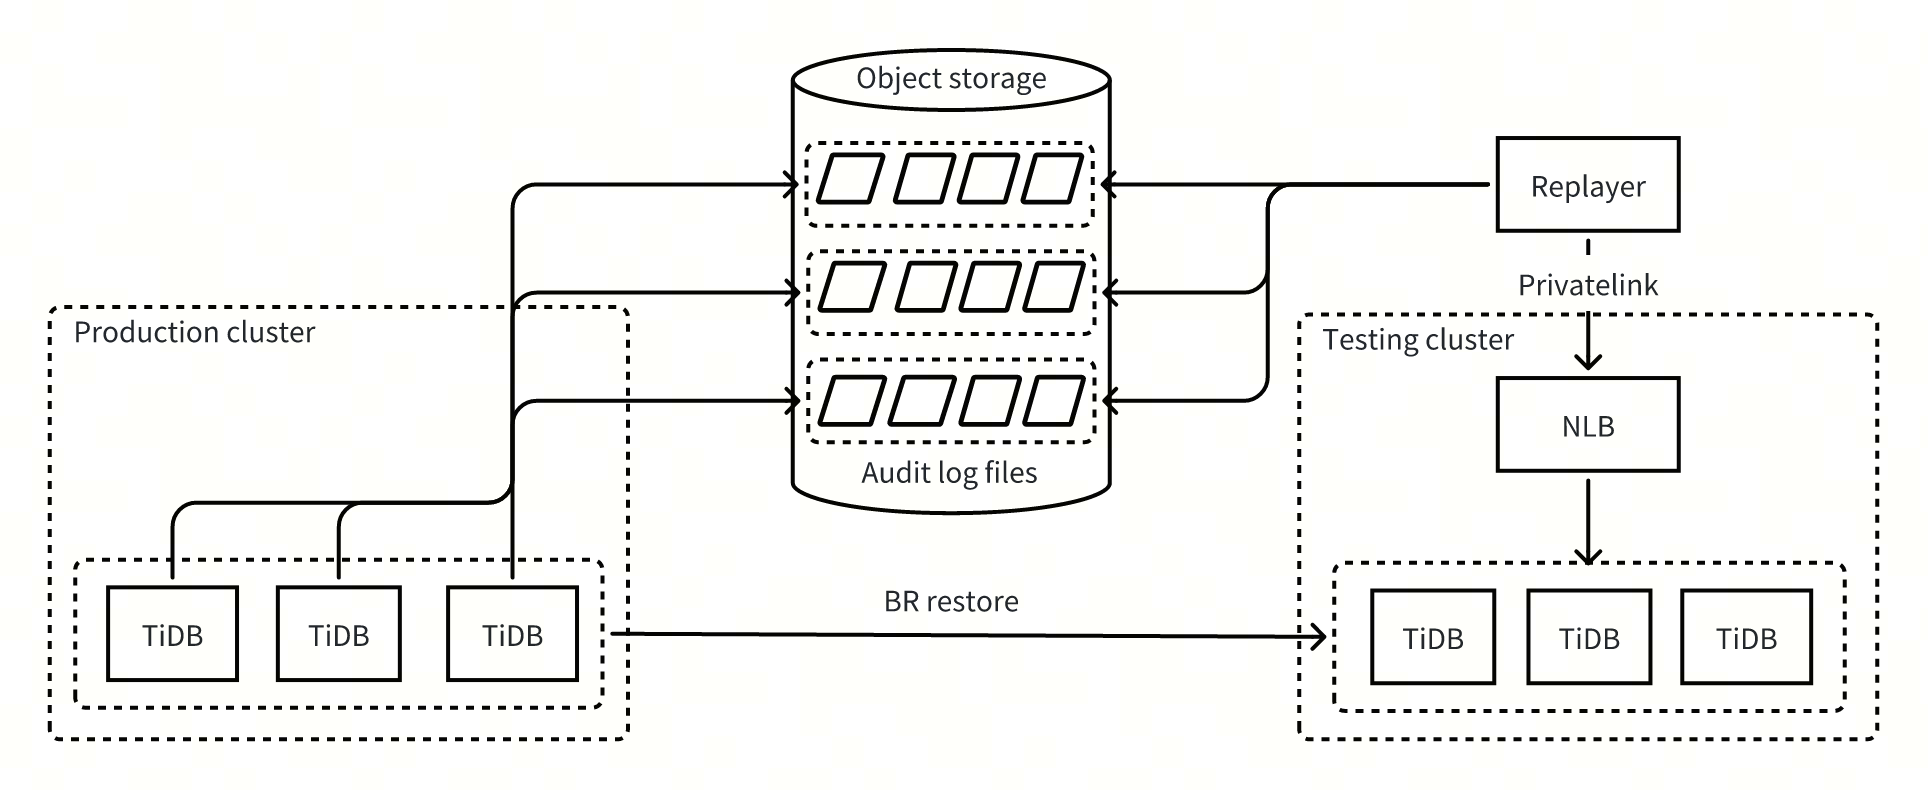
How TiDB Cloud Traffic Replay Works
TiDB Cloud Traffic Replay is an integrated operational workflow, not just a tool.
1. Storage & Security
To begin, you must enable audit logging via the web console, which records requests directly to object storage (e.g., S3).
- Encryption: Audit logs are stored in encrypted S3 buckets. Data is encrypted in transit via TLS.
- Sensitive Data Exclusion: Audit logs contain original SQL statements. To ensure high fidelity, the data is not masked during replay. However, users can manage data privacy at the source: during the recording phase, you can selectively exclude specific databases, tables, or sensitive SQL types.
- Retention: Ensure your log retention window covers the “peak traffic” period you wish to replay.
2. The Operational Flow
- Environment Setup: Before replaying, create a test cluster and use the TiDB Cloud BR tool to restore production data to this test cluster (usually taking just a few hours). The test cluster size is a trade-off:
- 1:1 Cluster: For highest fidelity (validating P99 latency and resource contention).
- Scaled-down Cluster: For cost-effective directional testing. Note: Expect different absolute latency and hotspot behavior.
- Inputs: Select the backup snapshot’s timestamp as the replay’s starting point. You can manually terminate the session at any time once you have gathered sufficient data.
- Execution: The replay tool then begins reading audit logs from that timestamp, parsing them into SQL statements, and executing them on the test cluster. The engine maps production connection IDs 1-to-1 to test connections, preserving transaction states.
3. Outputs
Once complete, TiDB Cloud generates a comparison report for efficiently comparing cluster health based on:
- Key Metric Diffs: CPS, Latency, and CPU deltas.
- Slow Query Diffs: Queries that were fast in production but slow in the new version.
- Top SQL Diffs: Queries that consume more CPU resources in the new version.
The chart below compares the CPS, component CPU usage, and latency results from a customer’s pre-upgrade traffic replay:
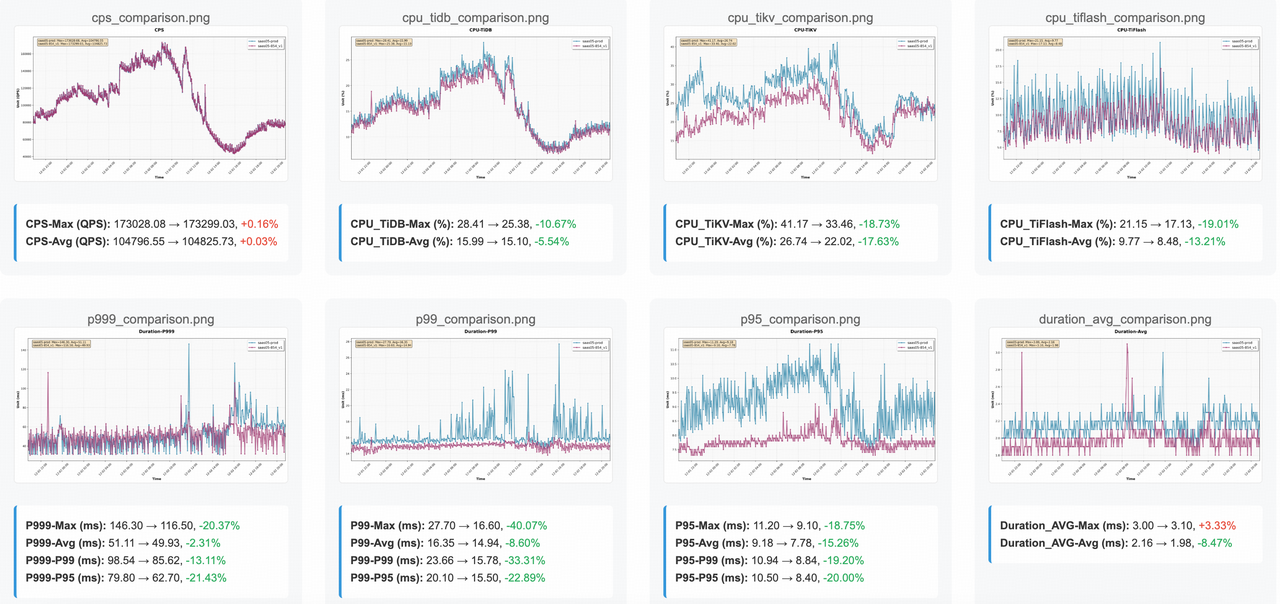
The chart shows:
- CPS Overlap: The CPS margin of error is within 1%, with the comparison curves nearly overlapping, indicating that the workload fidelity is nearly perfect. We are testing the actual pressure of your business.
- P999 Latency: The max P999 latency decreases by more than 20%. The tail latency matters because upgrades often impact complex edge-case queries.
- CPU Utilization: The CPU usage of TiDB, TiKV, and TiFlash decreases by more than 10%. You have identified a clear performance gain or cost-saving opportunity.
Next, we have a comparison of slow queries and resource-intensive SQL statements:
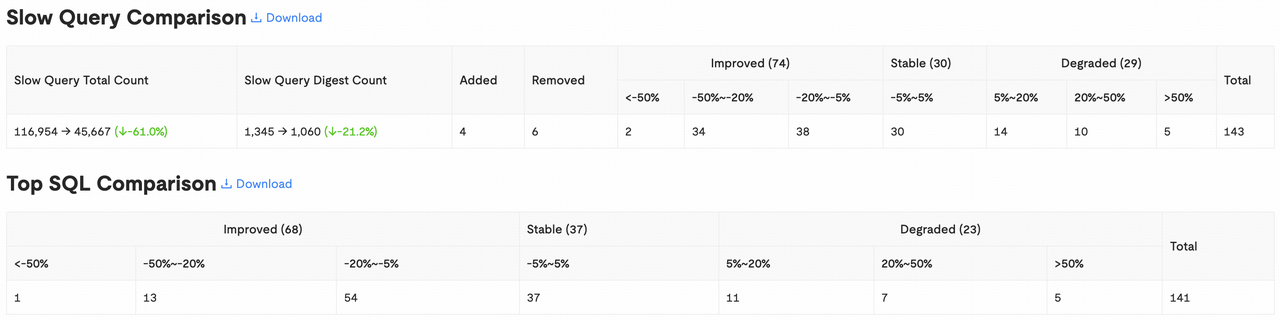
It is evident that the total number of slow queries decreased significantly, and optimized SQL statements far outnumbered those that showed regression. For the identified regressions, we can download the details and bind their execution plans to prevent any business impact after the upgrade.
The Regression Playbook: What if Things Go Wrong?
Finding a regression is a “win”—it means you caught it early. Follow this sequence:
- Identify: Locate the specific SQL Digest in the “Slow Query” section.
- Confirm: Compare execution plans. Is it a stats drift or an optimizer change?
- Remediate: Use SQL Plan Binding to lock in a known “good” plan or update statistics.
- Validate: Re-run the replay session to ensure the fix holds under production pressure.
Limitations to Keep in Mind
Users should be aware of the following technical constraints inherent in the replay process:
- Inter-Connection Temporal Drifts: The absolute temporal alignment between independent sessions may vary, potentially leading to a different global execution order than seen in production.
- DML Result Divergence: The results of DML statements may differ from production. For example, if a table uses Auto-increment columns, the generated IDs in the replay environment may not match those in production due to differences in concurrency timing or environment variables.
Conclusion
By achieving 99% accuracy in workload reproduction, Traffic Replay on TiDB Cloud transforms upgrades from a “risky event” into a “validated routine.”
Ready to secure your next upgrade? Run a 30-minute traffic session from your last peak period, and compare your P999 latency and Top SQL CPU time.
Spin up a database with 25 GiB free resources.

TiDB Cloud Dedicated
A fully-managed cloud DBaaS for predictable workloads
TiDB Cloud Starter
A fully-managed cloud DBaaS for auto-scaling workloads