
From the outset, Prometheus has served as a go-to tool for real-time performance metric collection, storage, querying, and observability in TiDB. Additionally, TiDB supports offline diagnostics using TiDB Clinic, which allows for replaying collected metrics to investigate historical issues.
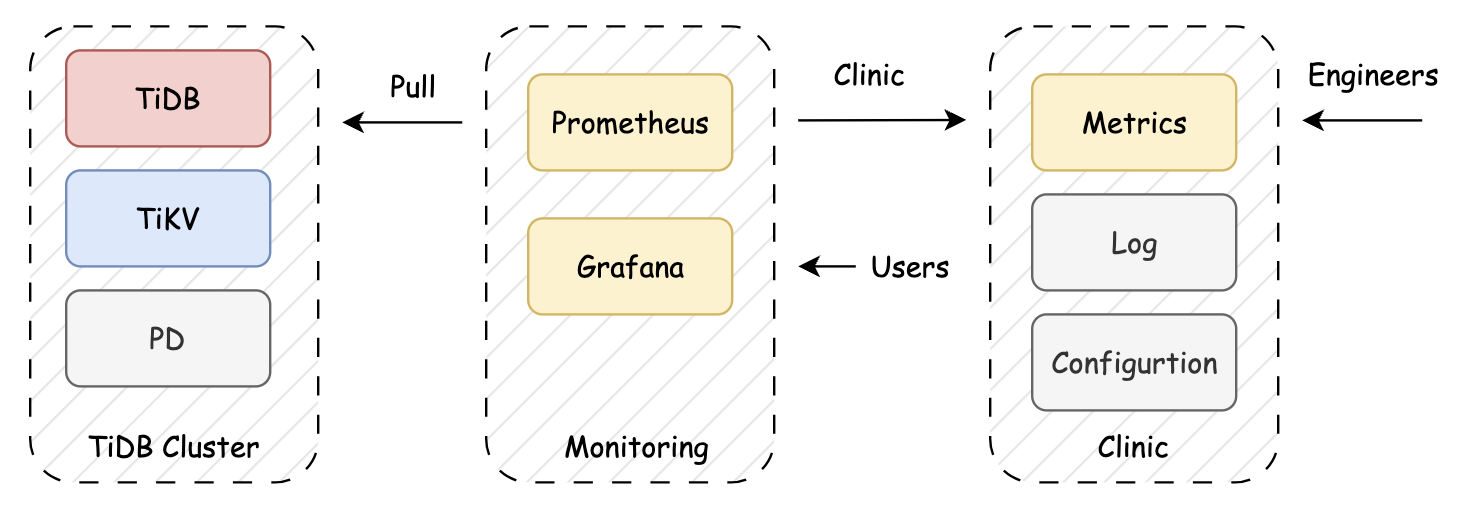
Figure 1. How TiDB Clinic provides offline diagnostics.
However, as deployments scaled, so did the challenges of using Prometheus. This blog explores those growing pains and why we ultimately transitioned to VictoriaMetrics, a high-performance, open-source time series database and monitoring solution.
TiDB Observability: The Limitations of Prometheus at Scale
Pinterest is one of PingCAP’s largest enterprise customers, operating a TiDB cluster with over 700 nodes handling 700K+ QPS. However, the team began to encounter monitoring issues. During diagnostic sessions with TiDB Clinic, Prometheus consistently crashed, escalating operational burdens and delaying incident resolution.
Scalability Issues
During PingCAP’s work with the Pinterest team, they observed frequent out of memory (OOM) crashes in Prometheus, even on a high-end i4i.24xlarge instance (96 cores, 768GB RAM). Query failures and long restart times significantly impacted their ability to diagnose issues effectively.
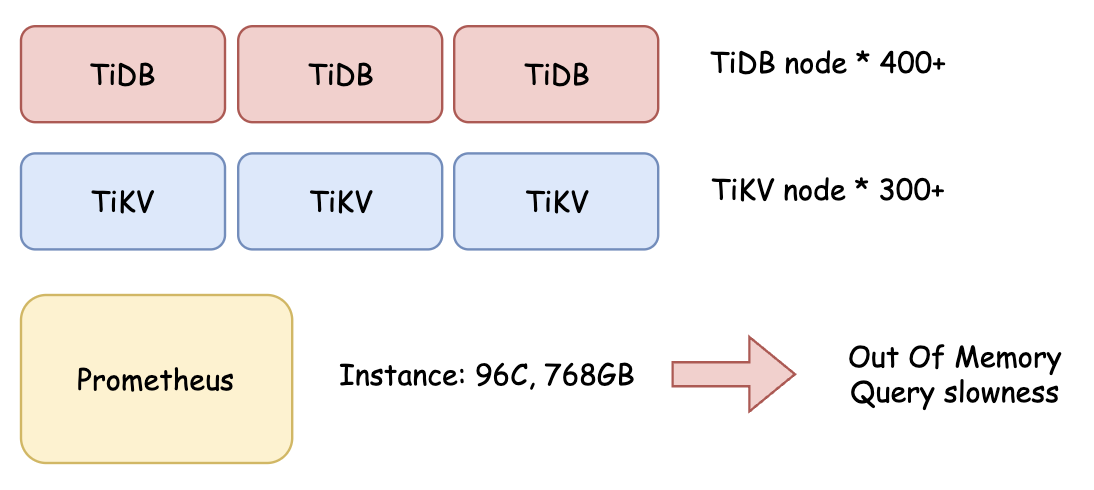
Figure 2. A diagram representing Pinterest’s OOM crash using Prometheus.
OOM (Out of Memory) Problem
When executing large queries, Prometheus frequently ran OOM, leading to crashes. The restart process posed additional challenges:
- Long Recovery Time: After an OOM crash, Prometheus needed to replay the Write-Ahead Log (WAL), a process that could take at least 40 minutes, sometimes failing altogether.
- Recurring OOMs: In some cases, the WAL replay triggered another OOM, preventing Prometheus from recovering.
- Extended Downtime & Data Loss: This instability led to prolonged monitoring outages and potential metric loss, making it unreliable for mission-critical clusters.
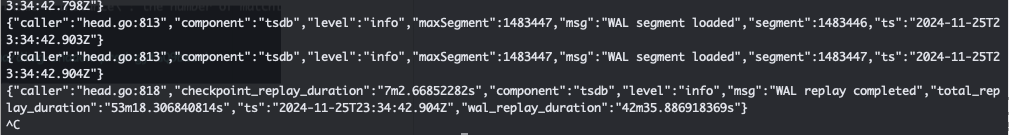
The below logs show crash recovery duration in a test environment with 400 nodes.
WAL start at 22:52:07

WAL finished at 23:34:32, spent 42mins
These limitations highlighted the need for a more scalable and resilient monitoring solution.
Query Performance
For large queries, we had to limit the time range to 15 minutes; otherwise, the query would either become slow or fail entirely.
A similar issue occurred with clinic data collection. When attempting to retrieve 1 hour of metrics, the query would run for 40 minutes before eventually failing due to OOM.
Total Cost of Ownership (TCO)
With Prometheus, we had to allocate a large monitoring instance (i4i.24xlarge, 96 cores, 768GB RAM), yet it still struggled with stability and performance.
Why TiDB Switched to VictoriaMetrics for Enhanced Observability
To meet the evolving needs of our internal teams and cloud customers, we evaluated alternative time-series backends and ultimately migrated to VictoriaMetrics. Below are key reasons behind the switch and the concrete improvements that followed.
1. Better Resource Utilization
After migrating to VictoriaMetrics, we observed a significant reduction in resource consumption:
- CPU usage below 50%
- Memory usage remained under 35%, eliminating OOM crashes.
- Stable performance, even under heavy query loads.
2. Improved Query Performance
- Large queries that previously worked only for a 15-minute window in Prometheus can now span hours in VictoriaMetrics.
- Faster query execution, making troubleshooting and historical analysis more efficient.
- However, some of the largest queries still face challenges and cannot fully execute, indicating room for further optimization.
3. Lower Resource Consumption and Improved TCO
After switching to VictoriaMetrics, Pinterest significantly reduced its resource consumption while improving stability. Additionally, better storage efficiency helped lower disk usage, making monitoring more cost-effective.
Overall, VictoriaMetrics provided greater stability, efficiency, and scalability, making it a more reliable solution for monitoring TiDB.
After validating the improvements with Pinterest, the team there successfully migrated to VictoriaMetrics.
TiDB Observability: Performance Test Results
To evaluate VictoriaMetrics’ impact, we conducted tests on Pinterest’s cluster using different configurations. The results showed that VictoriaMetrics significantly reduced resource usage and improved query performance, as shown in the below table.
| Metrics | Duration | Performance |
| Prom – KV Request | last 15mins | Failed |
| VM – KV Request – Default | last 15mins | Failed 30s |
| VM – KV Request – Tuned | last 15mins | Failed 1mins |
| VM – KV Request – Release | last 15mins | Success 3mins |
| Prom – 99% grpc request duration | Last 30mins | Failed 26s |
| Prom – 99% grpc request duration | Last 1h | Failed 15s |
| VM – 99% grpc request duration – default | Last 1h | Success 8.4s |
| VM – 99% grpc request duration – Tuned | Last 1h | Success 7.4s |
| VM – 99% grpc request duration – Release | Last 1h | Success 6.5s |
Key Takeaways
- Prometheus consistently failed on KV requests, while VictoriaMetrics showed significant improvements, especially in the Release configuration (success in 3 mins).
- Prometheus struggled with gRPC request duration, failing even for a 30-minute or 1-hour query.
- VictoriaMetrics significantly improved gRPC query performance, reducing execution time from 8.4s (Default) to 6.5s (Release).
- Different VictoriaMetrics configurations (Default, Tuned, Release) adjusted parameters like maxQueryDuration and maxSeries, impacting performance and success rates.
A Smooth Migration Strategy
Given that the data retention period was 10 days, we took a gradual migration approach to minimize risks and ensure a smooth transition from Prometheus to VictoriaMetrics.
Step 1: Parallel Deployment for Observation
- Based on our testing results, we found that scraping metrics had a minimal impact on the TiDB cluster.
- Instead of an immediate switch, we opted to run Prometheus and VictoriaMetrics in parallel, allowing us to observe performance and stability without disrupting existing monitoring workflows.
Step 2: Validation & Monitoring
- During this phase, we compared the data accuracy, query performance, and system stability between Prometheus and VictoriaMetrics.
- Engineers continuously monitored VictoriaMetrics’ resource utilization, query response times, and failure rates to ensure reliability.
Step 3: Final Cutover
- Once we gathered sufficient monitoring data and confirmed that everything was running smoothly, we fully switched to VictoriaMetrics.
- At this point, Prometheus was shut down, completing the migration without downtime or data loss.
This progressive migration strategy allowed us to ensure a stable transition while avoiding the risks of an abrupt switch.
Configuration and Integration Considerations
Migrating from Prometheus to VictoriaMetrics required adjustments across several key components, including scrape configurations, discovery files, startup scripts, Grafana dashboards, and clinic integration.
Scrape Configuration & Discovery Files
- VictoriaMetrics maintains compatibility with most Prometheus setups.
- We were able to reuse existing scrape configuration files and discovery files with minor modifications to handle incompatible parameters.
Startup Script Testing
We tested three different VictoriaMetrics startup configurations to balance query performance, resource limits, and stability. We ended up choosing a tuned configuration approach.
1. Default Configuration (Baseline Setup)
- Basic setup with minimal tuning
- Configured for 10-day retention and max scrape size of 400MB
docker run -it -v {PATH}/victoria-metrics-data:/victoria-metrics-data \
--network host -p 8428:8428 victoriametrics/victoria-metrics:v1.106.1 \
-retentionPeriod=10d \
-promscrape.config=/victoria-metrics-data/vm.config \
-promscrape.maxScrapeSize=400MB
2. Tuned Configuration (Slight Limits Increase, Final Choice ✅)
- Increased query duration and series limits to handle larger queries.
docker run -it -v {PATH}/victoria-metrics-data:/victoria-metrics-data \
--network host -p 8428:8428 victoriametrics/victoria-metrics:v1.106.1 \
-search.maxSeries=5000000 \
-search.maxLabelsAPISeries=5000000 \
-search.maxQueryDuration=1m \
-promscrape.config=/victoria-metrics-data/vm.config \
-promscrape.maxScrapeSize=400MB \
-search.maxSamplesPerQuery=1000000000 \
-search.logSlowQueryDuration=30s \
-retentionPeriod=10d
3. Release Configuration (Aggressive Limits, Not Chosen)
- Further increased limits to support more complex and long-running queries.
docker run -it -v /mnt/docker/overlay2/victoria-metrics-data:/victoria-metrics-data \
--network host -v /var/lib/normandie:/var/lib/normandie:ro,rslave \
-p 8428:8428 victoriametrics/victoria-metrics:v1.106.1 \
-search.maxSeries=50000000 \
-search.maxLabelsAPISeries=50000000 \
-search.maxQueryDuration=10m \
-promscrape.config=/victoria-metrics-data/vm.config \
-promscrape.maxScrapeSize=400MB \
-search.maxSamplesPerQuery=10000000000 \
-search.logSlowQueryDuration=30s \
-retentionPeriod=10d
Clinic Command for Diagnostics
To collect TiDB clinic diagnostics, we adjusted the command to use VictoriaMetrics as the Prometheus replacement:
tiup diag util metricdump --name {cluster_name} --pd={PD_URL}:{PD_PORT} \
--prometheus="{VICTORIA_URL}:8428" --from "-1h" --to "-0h"
Grafana Dashboard Adjustments
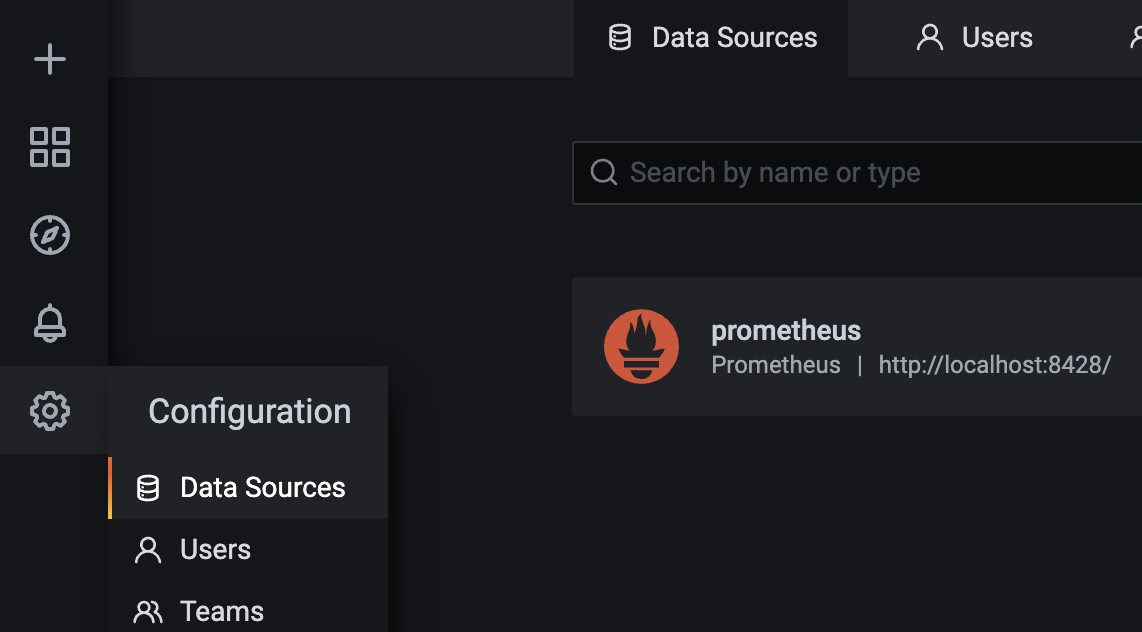
- We configured Grafana to use VictoriaMetrics as the Prometheus data source.
- Required modifications to each dashboard to default to the new VictoriaMetrics data source.
Final Thoughts: The Future of TiDB Observability
Observability remains a crucial pillar of maintaining a healthy, high-performance TiDB cluster. With that said, the move to VictoriaMetrics has greatly improved scalability, reliability, and efficiency.
Looking ahead, further enhancements could include:
- Optimizing for ultra-large queries.
- Exploring long-term storage solutions for historical metric retention beyond 10 days.
- Building a unified monitoring platform to improve resource usage and user experience.
VictoriaMetrics has proven to be a powerful foundation for TiDB observability at scale.
If you have any questions about TiDB’s approach to monitoring and observability, please feel free to connect with us on Twitter, LinkedIn, or through our Slack Channel.
Experience modern data infrastructure firsthand.

TiDB Cloud Dedicated
A fully-managed cloud DBaaS for predictable workloads
TiDB Cloud Starter
A fully-managed cloud DBaaS for auto-scaling workloads