
Key Takeaways
- Tail latency — not averages — is what breaks SLOs in distributed OLTP systems.
- Production clusters saw P999 drop from tens of seconds to sub-100ms after upgrading to TiDB 8.5, with no workload changes.
- The largest gains came from eliminating rare-but-catastrophic stalls: GC pauses, lock contention, and storage snapshot overhead.
- TiDB 8.5 optimizes across the full stack by removing unnecessary work, replacing expensive operations, and reordering tasks off the critical path.
- High-QPS, large-scale workloads with strict latency requirements benefit most.
Reducing P999 latency in distributed databases is one of the hardest challenges in modern OLTP systems. A handful of slow requests can cascade across services, break SLOs, and directly impact business outcomes, especially in latency-sensitive environments like trading platforms and real-time applications.
This is the challenge of tail latency. As systems scale, variability compounds: queueing amplifies small delays, fan-out turns rare slow sub-requests into frequent user-facing issues, and hidden bottlenecks across the stack create unpredictable spikes.
In practice, it’s not the median that hurts—it’s the P99 and P999. With TiDB 8.5, we address this at the root—not by improving averages, but by systematically reducing latency variance.
What We Observed in Production
TiDB 8.5 is a performance-focused release. In a controlled, in-place production upgrade (same workload and configuration; only the TiDB/TiKV kernel version changed from v7.5.6 to v8.5.4), we observed a step-change in what matters most for real OLTP services:
- Tail latency collapsed: P999 moved from tens of seconds tails down to sub-second, often tens of milliseconds in some windows.
- Slow-query pressure dropped: Slow query bursts reduced by roughly 30%–90% depending on the time window.
- Resource behavior became smoother: TiKV CPU usage shifted down by about 10%–25% on average, with fewer extreme spikes.
The following chart summarizes the latency distribution shift we observed across these production clusters. It compares the percentile-latency curve before (TiDB 7.5) and after (TiDB 8.5) the upgrade:
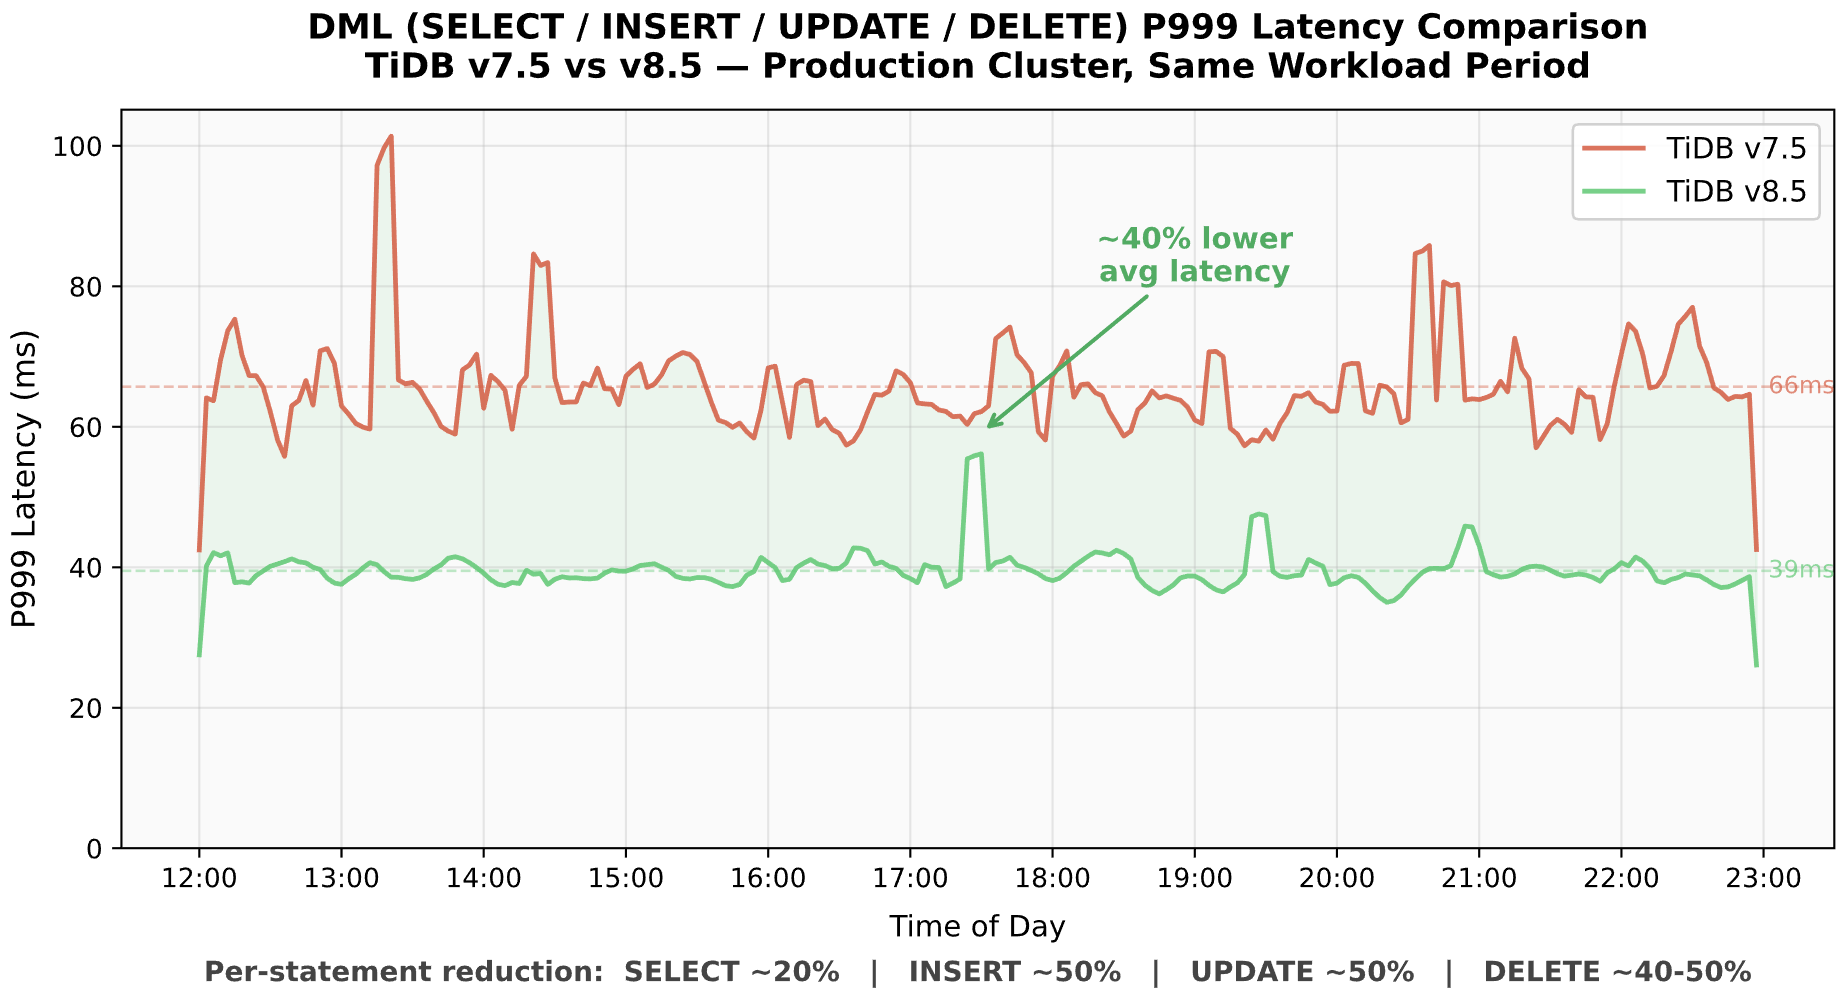
Fig. 1: The latency improvement in a mixed read/write OLTP workloads running on large-scale production clusters (100+ TiKV nodes, 4 TiB+ data per store, 150K+ QPS).
These results are not workload-specific, they reflect systematic improvements in how TiDB handles latency under pressure.
Which Workloads Benefit Most from TiDB 8.5
To understand where these improvements come from—and whether they apply to your system—it’s important to look at the workload characteristics that trigger tail latency in TiDB.
As the production results show, not every deployment sees the same level of improvement. The gains are most pronounced under specific conditions:
| Optimization | Root Cause | Best Suited For |
| Memory allocation pooling (Remove) | Go runtime GC pauses and goroutine scheduling delays cause sporadic latency spikes on the SQL layer | High QPS (100K+) with many short-lived OLTP queries; Go GC pauses visible in P99; tens of thousands of rows changing per second |
| ART membuffer (Replace) | Red-Black Tree MemDB spends most CPU time on key comparisons; O(log n) comparisons with long common-prefix keys are expensive | Large tables with many indexes; keys sharing long common prefixes (table prefixes, index prefixes); write-heavy DML on wide tables |
| Async snapshot / SST mutex (Reorder) | Storage async snapshot duration grows with SST file count; mutex contention blocks foreground writes during metadata operations | Large data volume per TiKV store (e.g., 4 TiB+); high SST file counts (100K–200K+); sustained write pressure alongside latency-sensitive reads |
| gRPC batching / TSO parallelizing (Remove) | Coordination overhead with PD and TiKV adds per-query round trips | High fan-out queries; deployments with many TiKV nodes; network latency to PD/TiKV |
In practice, the largest gains come from systems that combine high QPS, large data volumes, many indexes, and strict latency SLOs—where small inefficiencies compound into tail latency spikes.
For lower-QPS workloads or smaller datasets, the impact is less dramatic, since tail latency is less dominated by coordination and storage-level stalls. However, reduced baseline overhead still delivers measurable improvements.
How TiDB 8.5 Reduces P999 Latency in Distributed Databases
TiDB 8.5 addresses tail latency challenges through systematic optimizations across all layers of architecture. Rather than incremental tweaks, these are fundamental engineering improvements targeting the root causes of performance variability.
Optimization Strategy
In a distributed system like TiDB, latency emerges from dependencies across multiple stages—parallel execution, coordination, and wait events across the request path. The question is: How do you systematically reduce it?
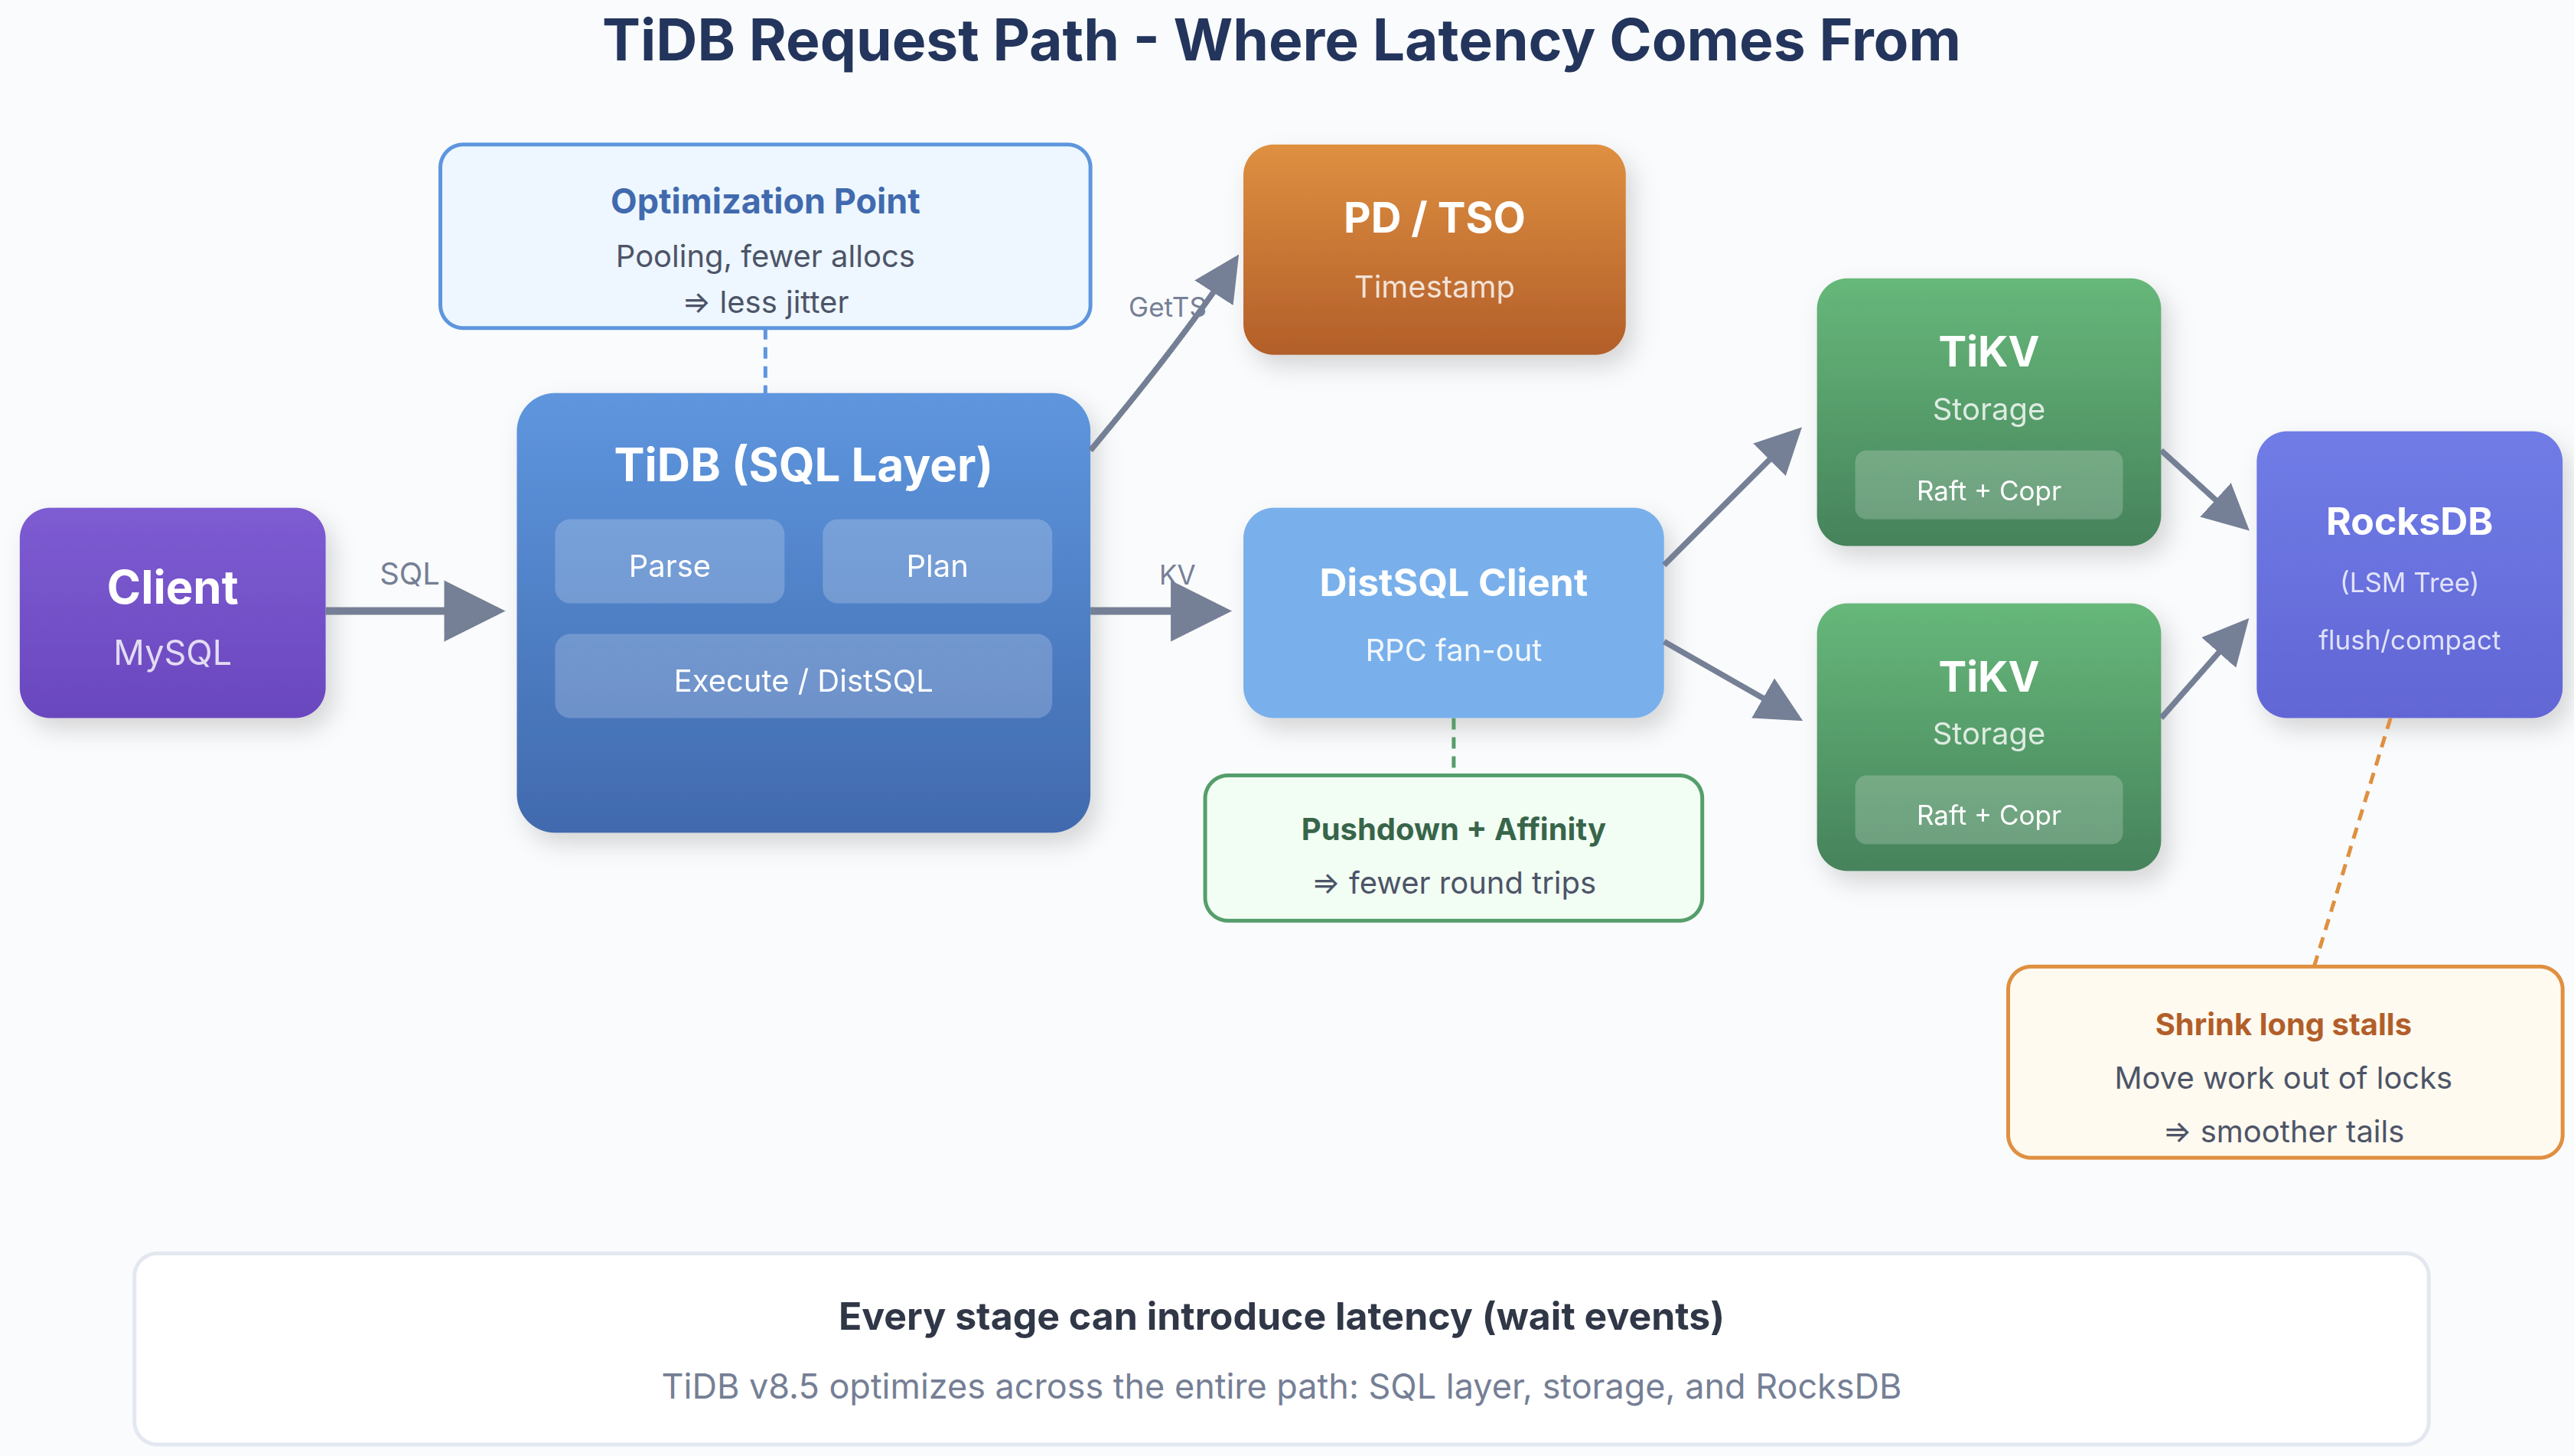
Fig. 2: Latency is introduced at every stage and effective optimization requires reducing work, round trips, and stalls across the entire stack.
These improvements are not isolated—they follow a consistent pattern. According to Serial Performance Optimization (OSDI’25), latency can be reduced through three core levers:
- Remove tasks from the critical path (fewer waits, fewer round trips)
- Replace expensive tasks with cheaper ones (better data structures, less contention)
- Reorder tasks to avoid stalls (pooling, pipelining, moving work out of hot locks)
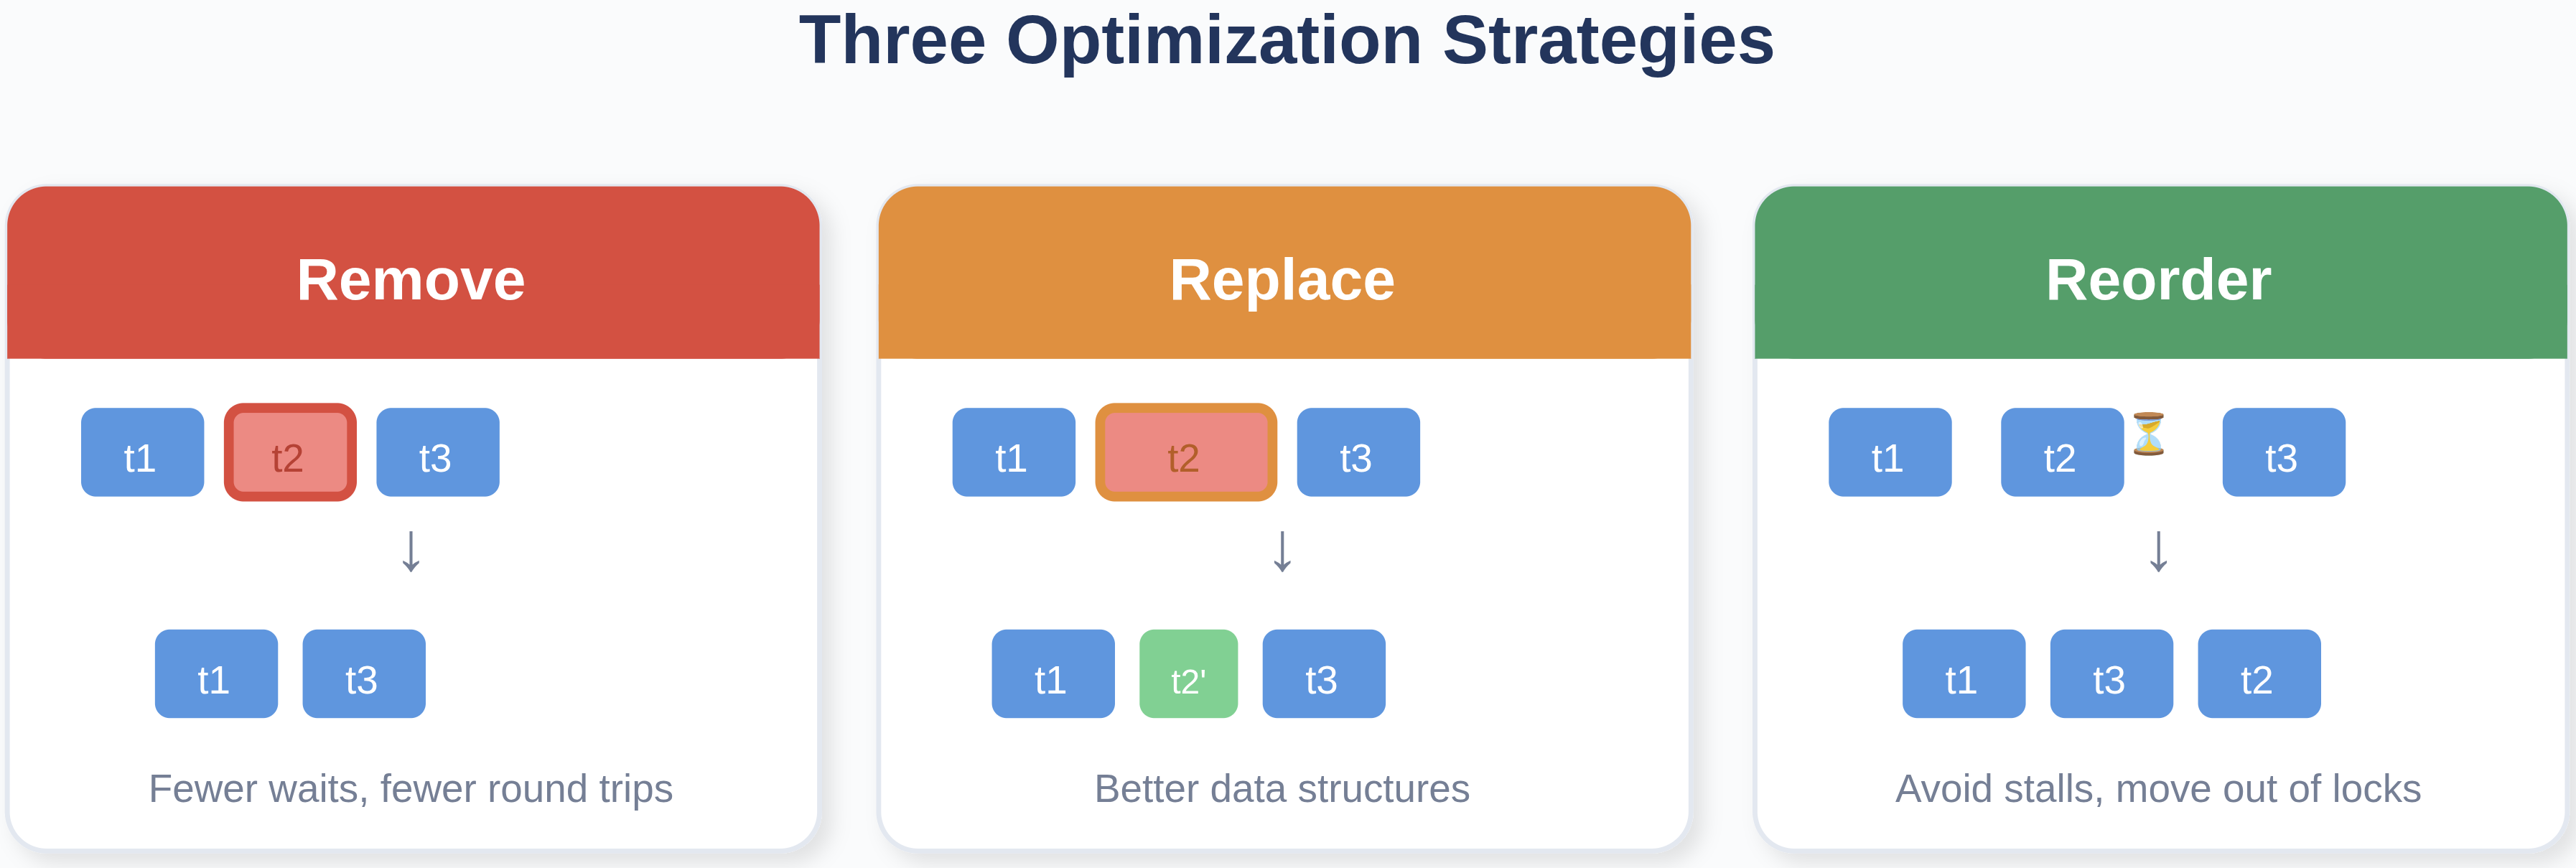
Fig. 3: The three optimization strategies described in Serial Performance Optimization (OSDI’25).
| Strategy | TiDB 8.5 Changes | Impact |
|---|---|---|
| Remove | Memory pooling, goroutine reuse, reduced RPC coordination | Lower GC and scheduling overhead |
| Replace | ART replacing Red-Black Tree MemDB | Fewer comparisons, better cache locality |
| Reorder | Async snapshot + SST mutex optimizations | Eliminates long stalls |
Key Optimization
The TiDB 8.5 performance work is a combination of these three moves across the TiDB -> TiKV -> RocksDB path:
The Removal
When this matters: The target cluster runs high-QPS OLTP workloads (100K+ QPS) with many short-lived queries. Under these conditions, the cumulative cost of per-query memory allocation, goroutine creation, and Go runtime scheduling/GC becomes a significant fraction of total query latency.
For TiDB, we typically assume that goroutines and memory are cheap and low-cost resources. However, in OLTP scenarios, many queries are sufficiently short that the time spent “waiting to do the real work” becomes noticeable. Examples include scheduling wait in the Go runtime and memory garbage collection.
How should we reduce coordination waiting and redundant distributed work by turning multiple small steps into one? TiDB 8.5 introduces several memory allocation optimizations:
- Goroutine Reuse: Instead of creating new goroutines for each coprocessor request, TiDB avoids starting extra goroutines in certaint coprocessor/distsql requests.
- Reduced Allocations in ExecDetails: Execution detail structures are now pooled and reused rather than allocated per-query.
- RuntimeStats Optimization: Runtime statistics collection has been optimized to reduce allocation overhead.
- BuildCopIterator Improvements: The coprocessor iterator construction path now uses pre-allocated buffers.
For example, memory allocation by handle keys (usually the primary key) processing in TiDB. It may seem trivial, but the impact is actually significant.
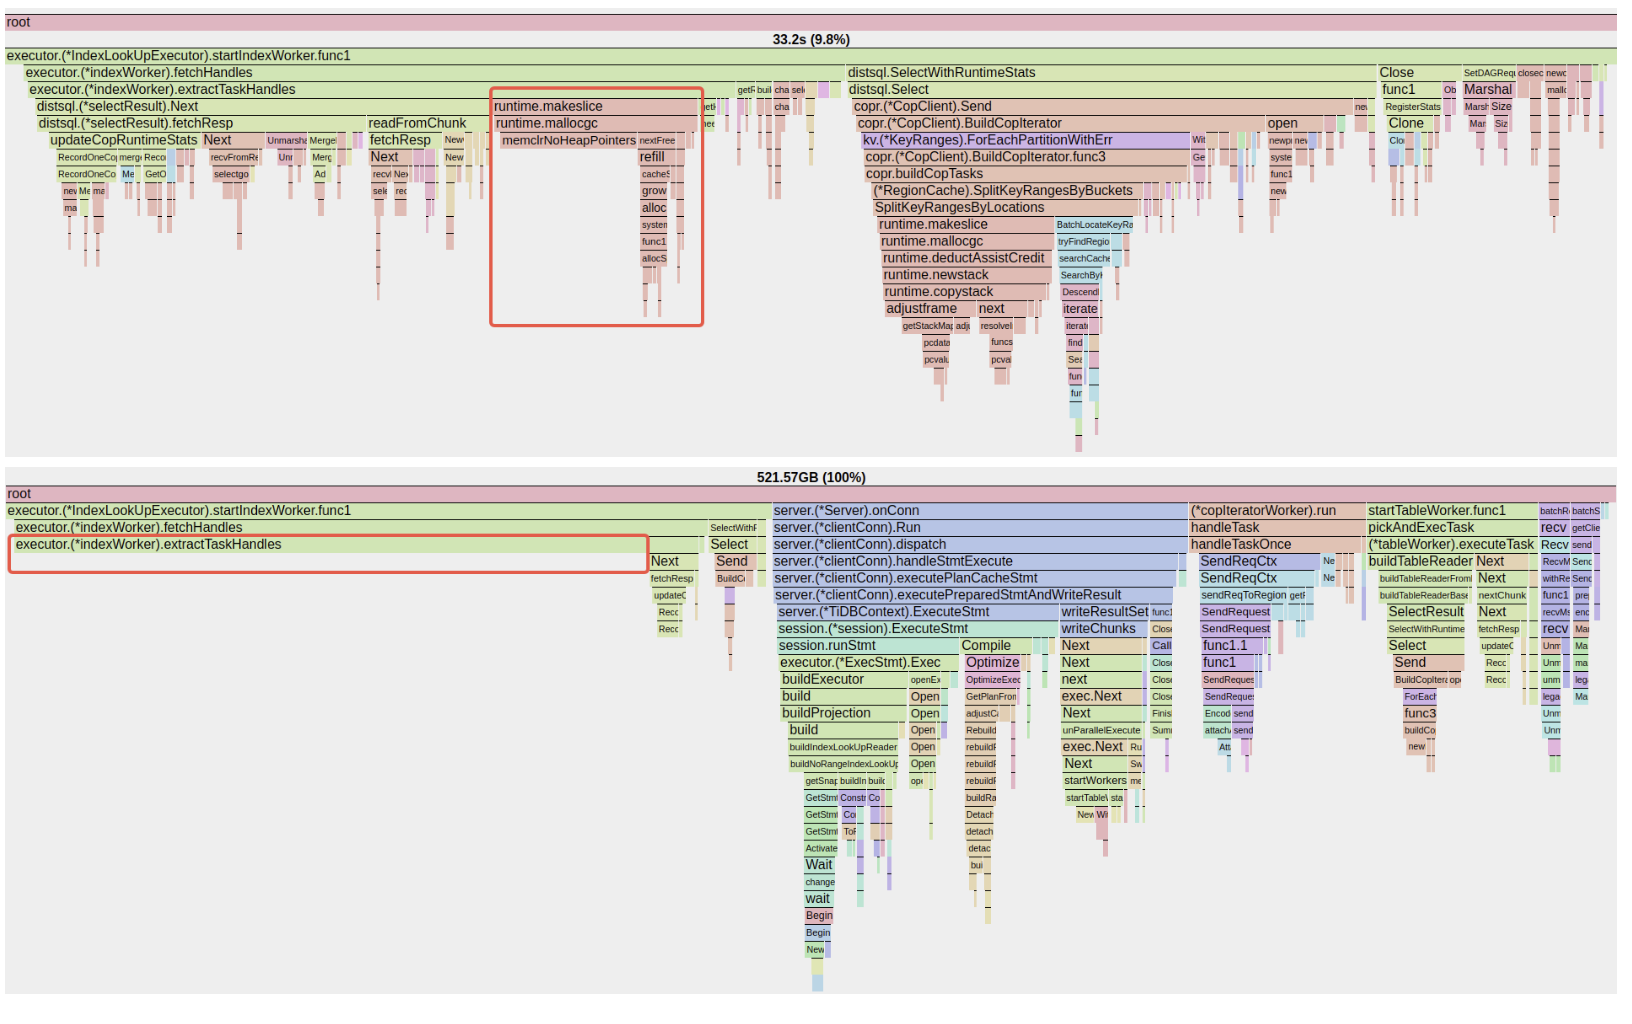
Fig. 4: CPU flame graph before and after optimization, highlighting reduced allocation overhead on the critical path
The Replacement
When this matters:
- If there are many large transactions or large batch size DML executions in the system, it means there would be a lot of
MemDBread/write operations during the execution, in which the Red-Black Tree does not perform well. - The user tables have many indexes, or user keys share long common prefixes (which is the norm in TiDB — all keys for a table start with
t{tableID}_rort{tableID}_i{indexID}). The longer the common prefix, the more expensive each Red-Black Tree comparison becomes, and the more CPU cycles are wasted on redundant byte comparisons.
Make hot-path data structures and algorithms cache-friendly. Some performance wins are not about distributed execution at all—they come from replacing a core in-memory mechanism with one that matches the workload’s key shapes. In TiDB, transactional workloads often involve keys with long common prefixes. Replacing comparison-heavy structures with prefix-friendly ones (e.g., radix-tree style indexing for transactional mem-buffers) reduces CPU cycles per mutation and improves cache locality. The result is higher throughput and, importantly, less latency jitter under load.
The “comparison problem” of Red-Black Tree based MemDB in TiDB:
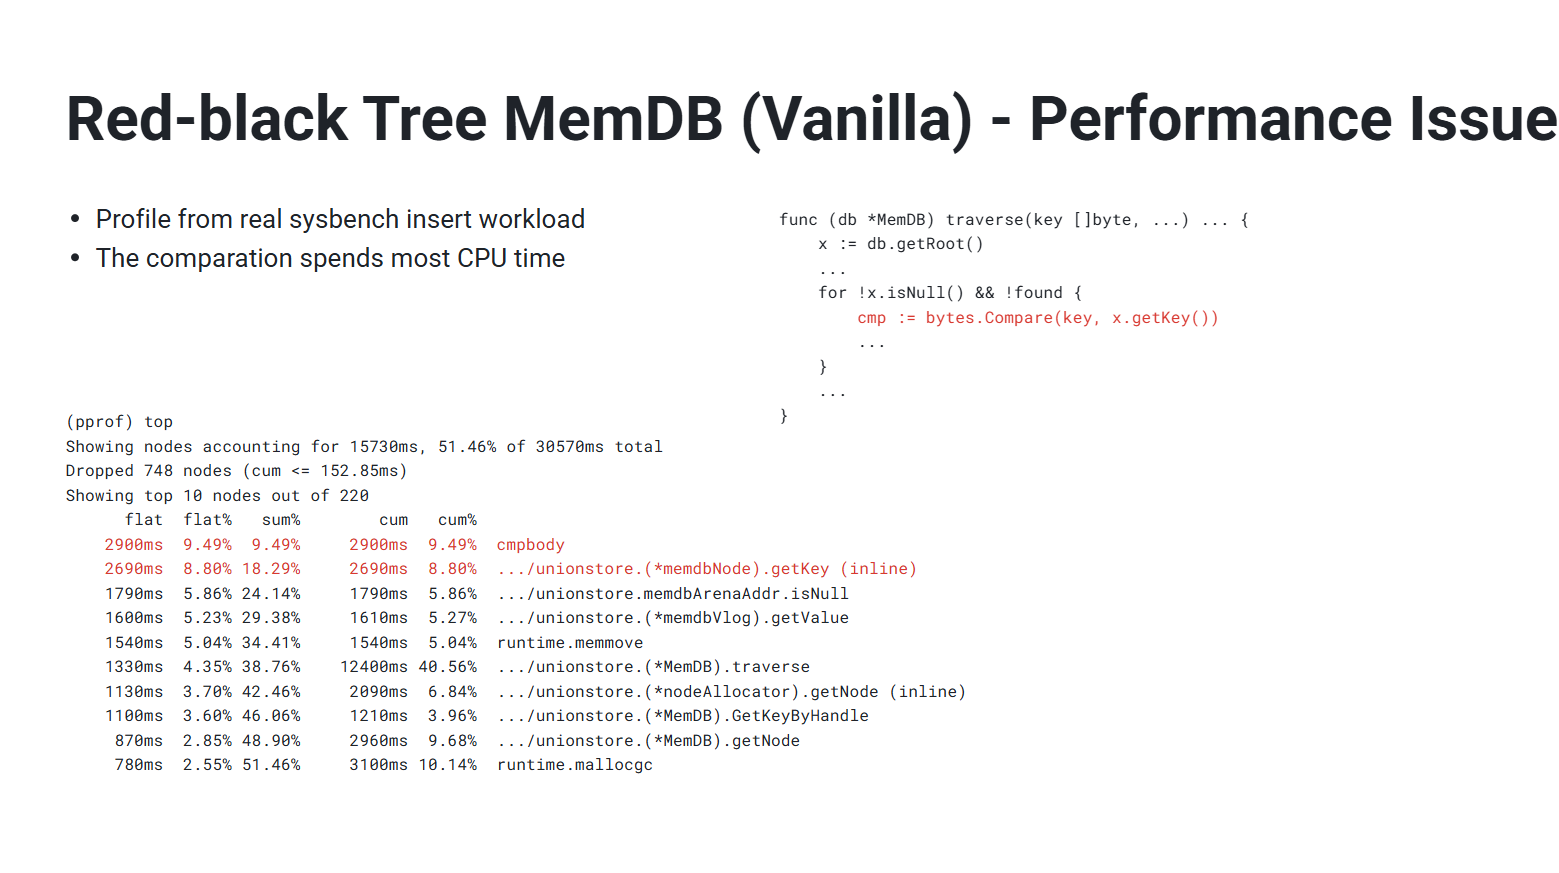
Fig. 5: Red-Black Tree MemDB CPU profile showing comparison-heavy hot path
TiDB 8.5 replaces the Red-Black Tree with ART as the default membuffer. ART is a radix tree-based in-memory index that:
- Provides O(k) lookup complexity where k is key length, independent of the number of keys.
- Is particularly efficient for keys with long common prefixes (e.g., table prefixes, index prefixes).
- Offers better cache locality compared to pointer-based tree structures.
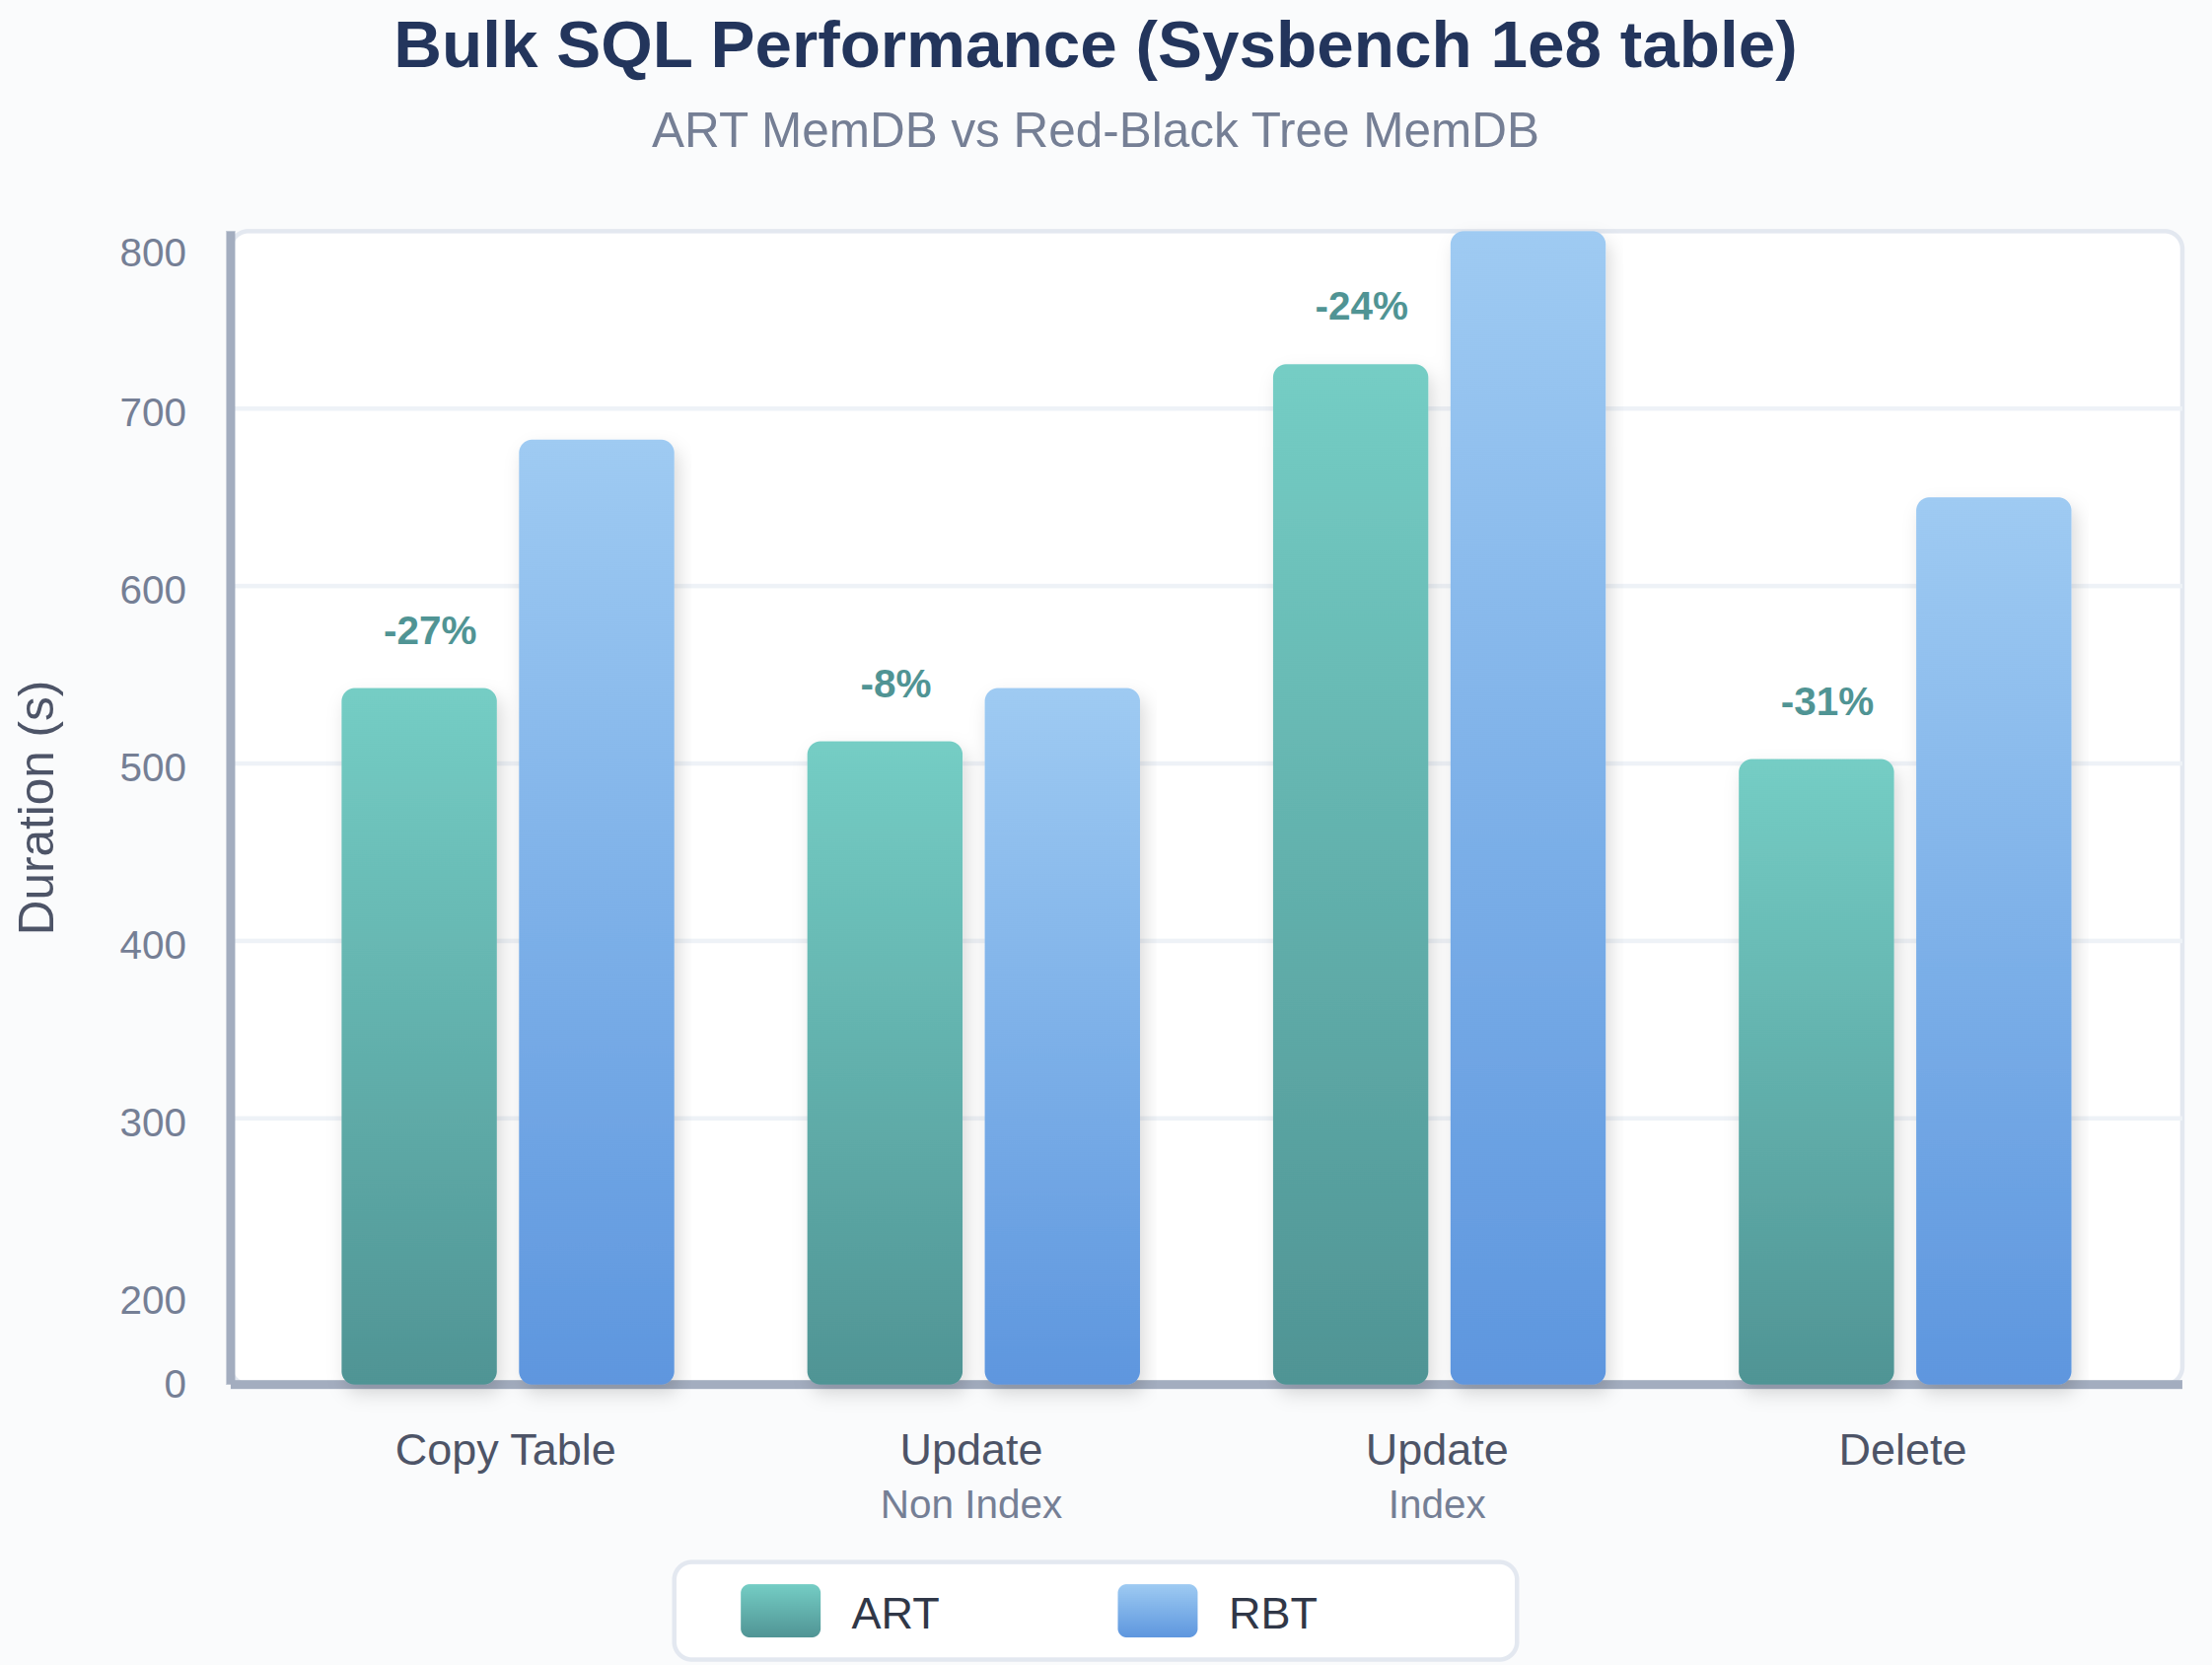
Fig. 6: ART MemDB reduces DML execution time across workloads compared to Red-Black Tree
From the copy table(“insert into select * from”), update_non_index, update_index, delete benchmark tests using sysbench schema, ART-based memdb all shows better performance.
The Reorder
When this matters: The TiKV stores in the target cluster hold large data volumes (multiple TB per node), resulting in high SST file counts (100K–200K). Under these conditions, storage metadata operations (like acquiring async snapshots) hold mutexes for durations that scale with file count, blocking foreground read and write operations. This is the primary cause of the rare-but-catastrophic multi-second latency spikes observed at P99.9+.
The easiest way to get minutes-long tails is to occasionally hit a “stop-the-world” style stall: Stack growth, goroutine churn, lock contention, or storage-engine critical sections that grow with data volume. TiDB 8.5 attacks this by making the system more predictable:
- Pooling/reuse instead of per-request goroutine churn on common executor paths.
- Move work out of contended locks (especially inside storage-engine metadata updates that can scale with SST file count).
- Avoid pausing foreground work during operational tasks (for example, reduce latency impact from SST ingestion by allowing safe concurrent writes and using latching where correctness needs it). Even when these changes look “small” in microbenchmarks, they disproportionately improve P99/P999 because they remove rare-but-catastrophic stalls.
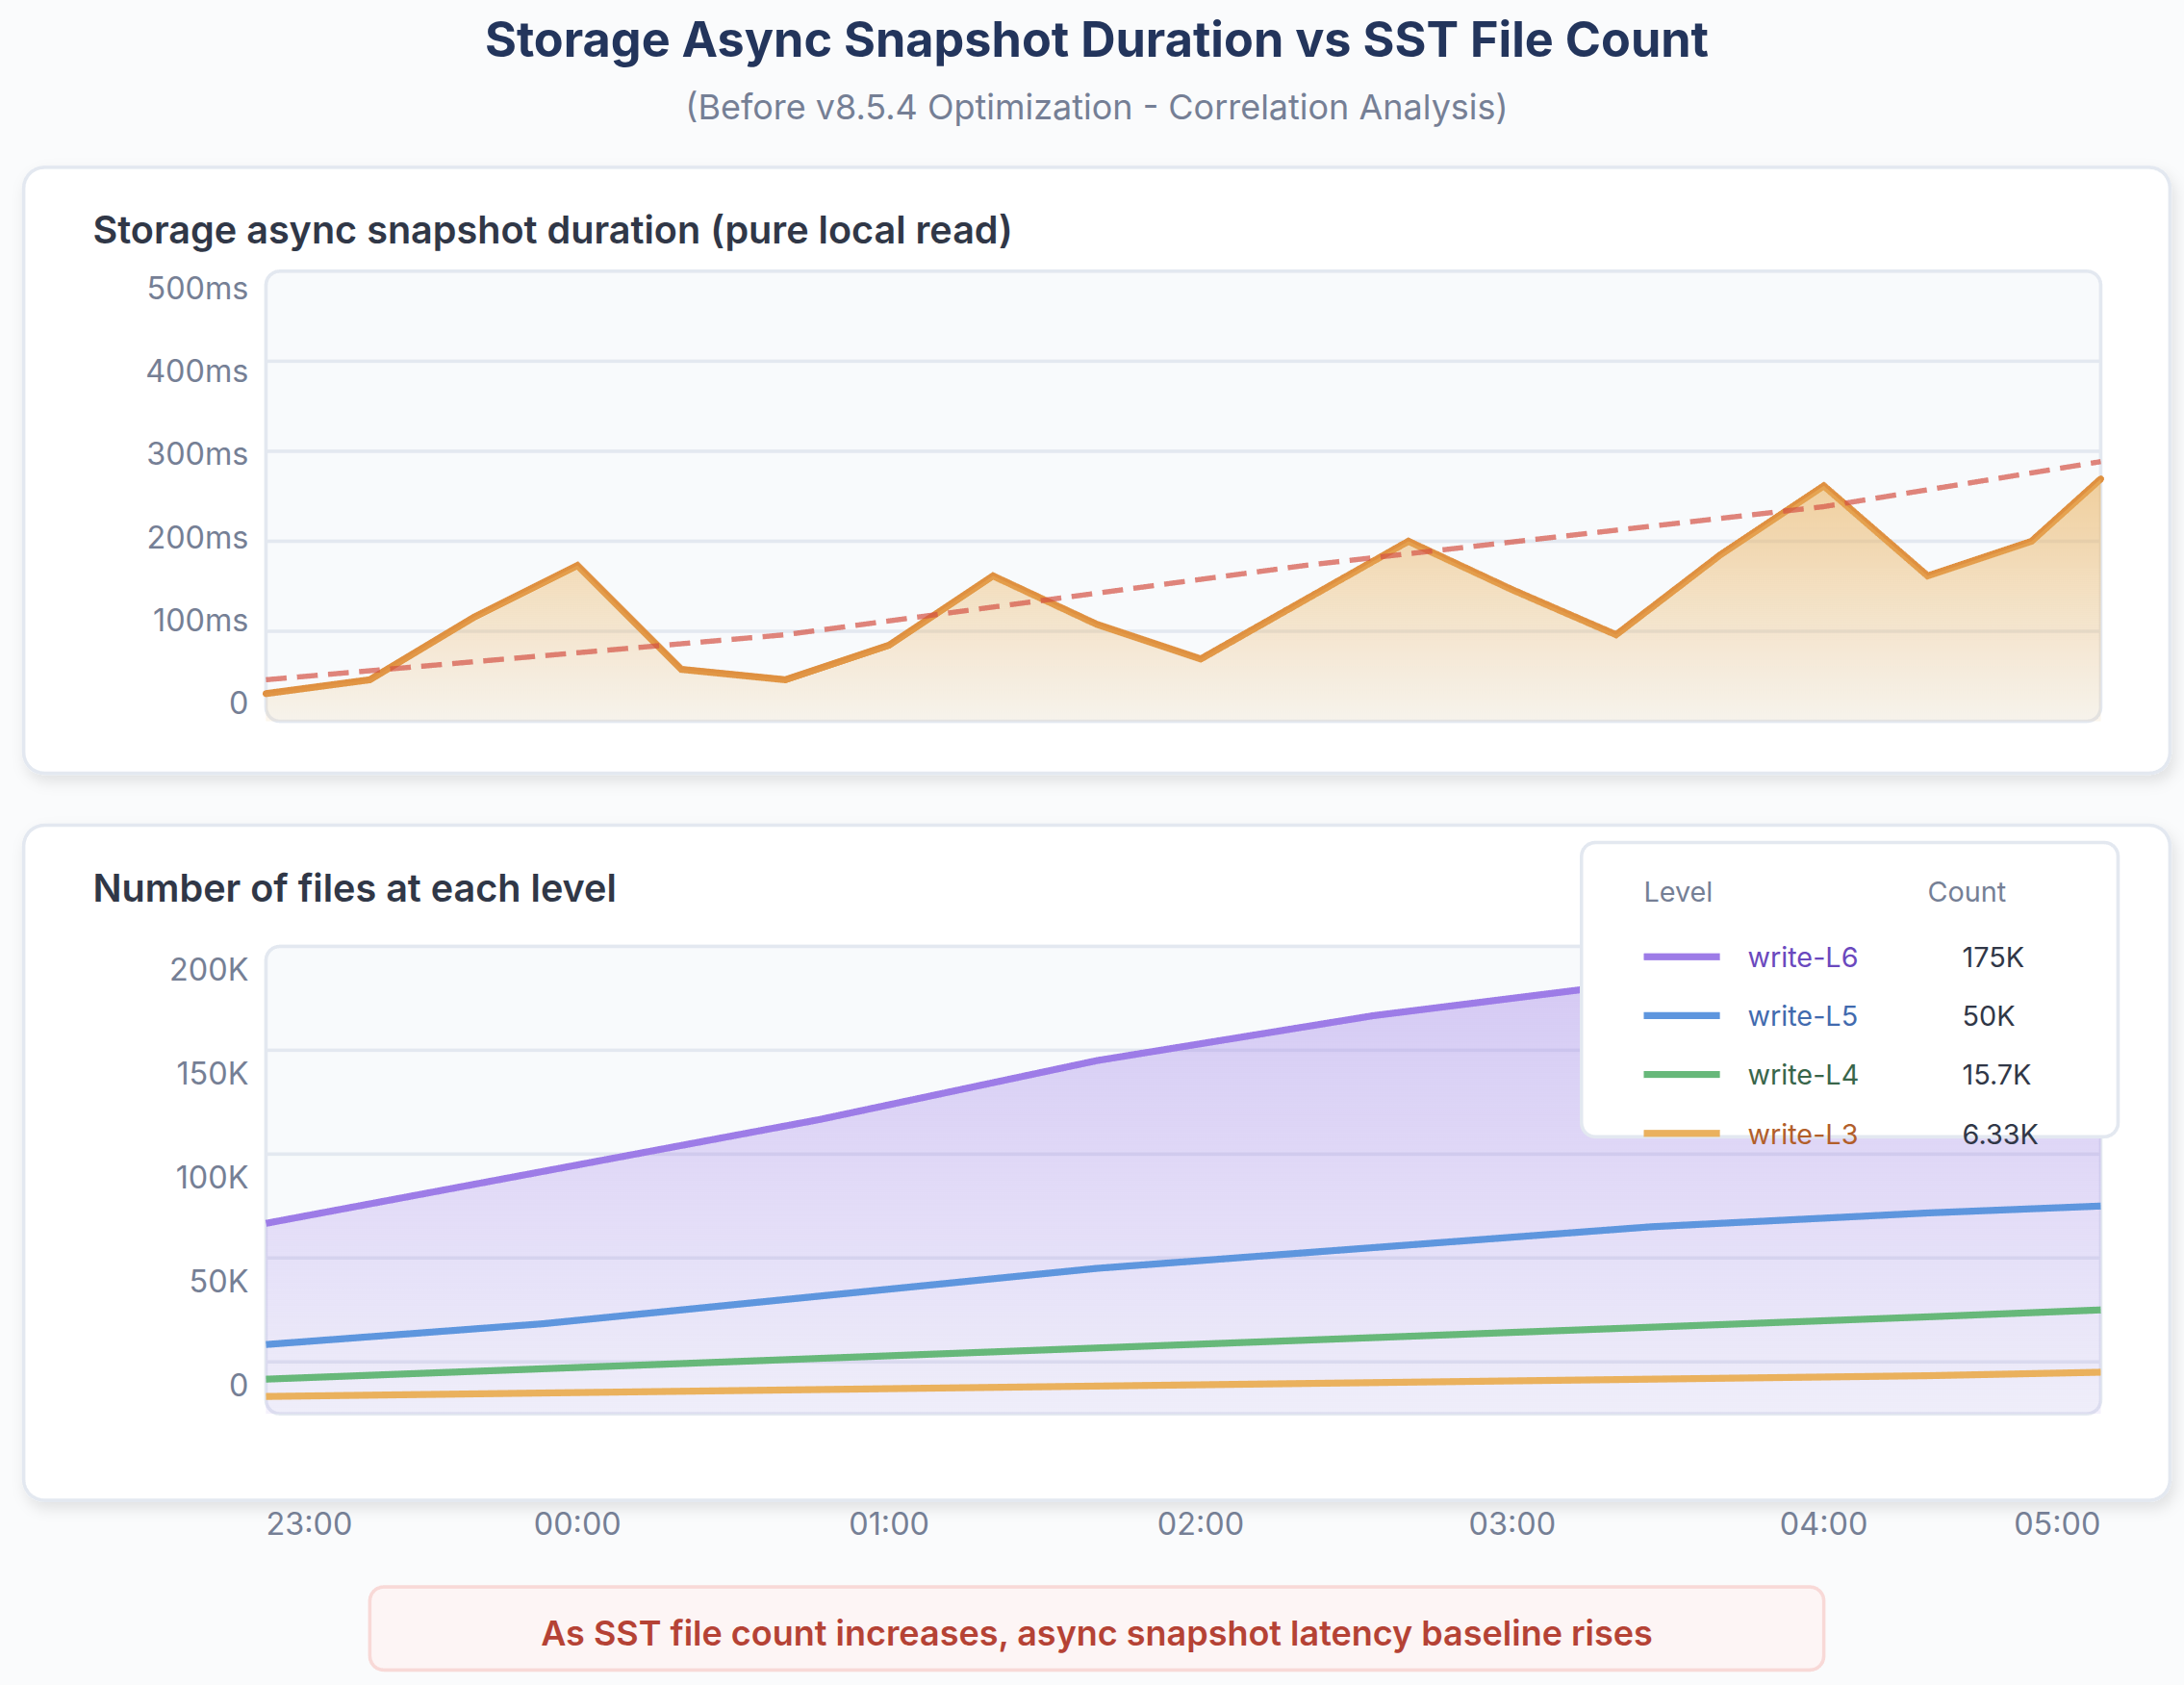
Fig. 7: As the number of SST files increases, the async snapshot duration’s tail latency is getting higher, which causes performance issues under the large data volume case.
The improvements in RocksDB are:
- Make
VersionStorageInfobe a pointer, so we can free it in the background thread. Previously, freeing this structure blocked the mutex, causing foreground writes to stall when SST file counts were high. - Move the generation of
file_locationsofSaveTointoPrepareApplywhich is out of mutex.
The results are as follows:
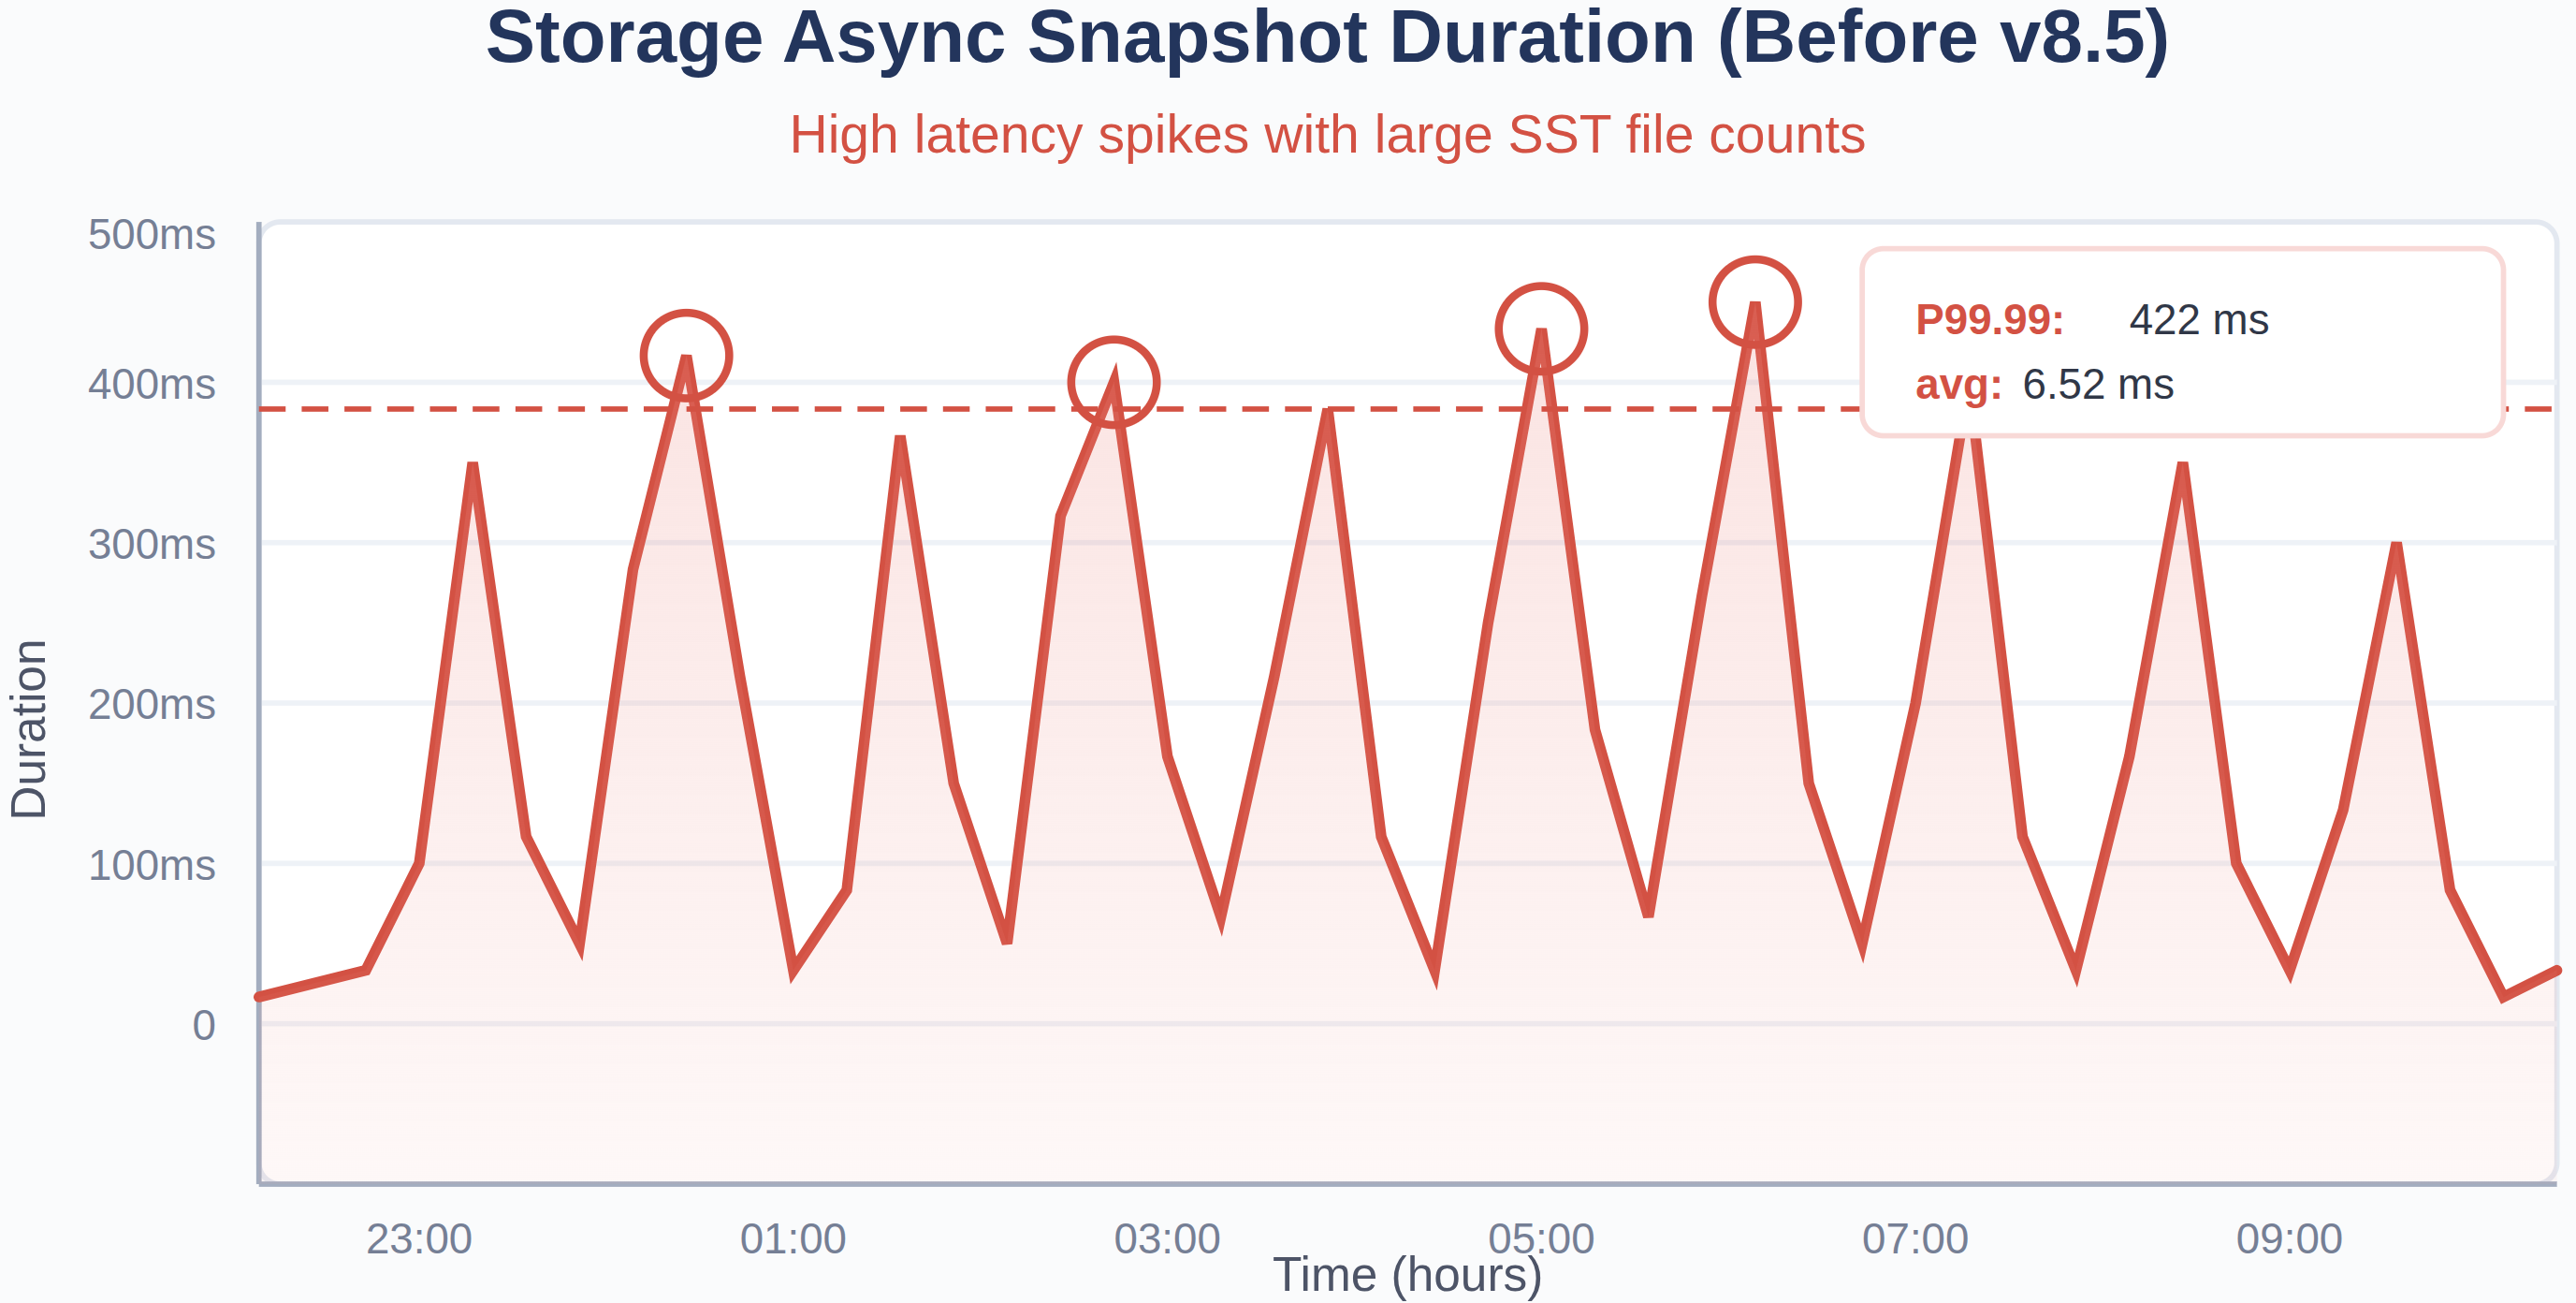
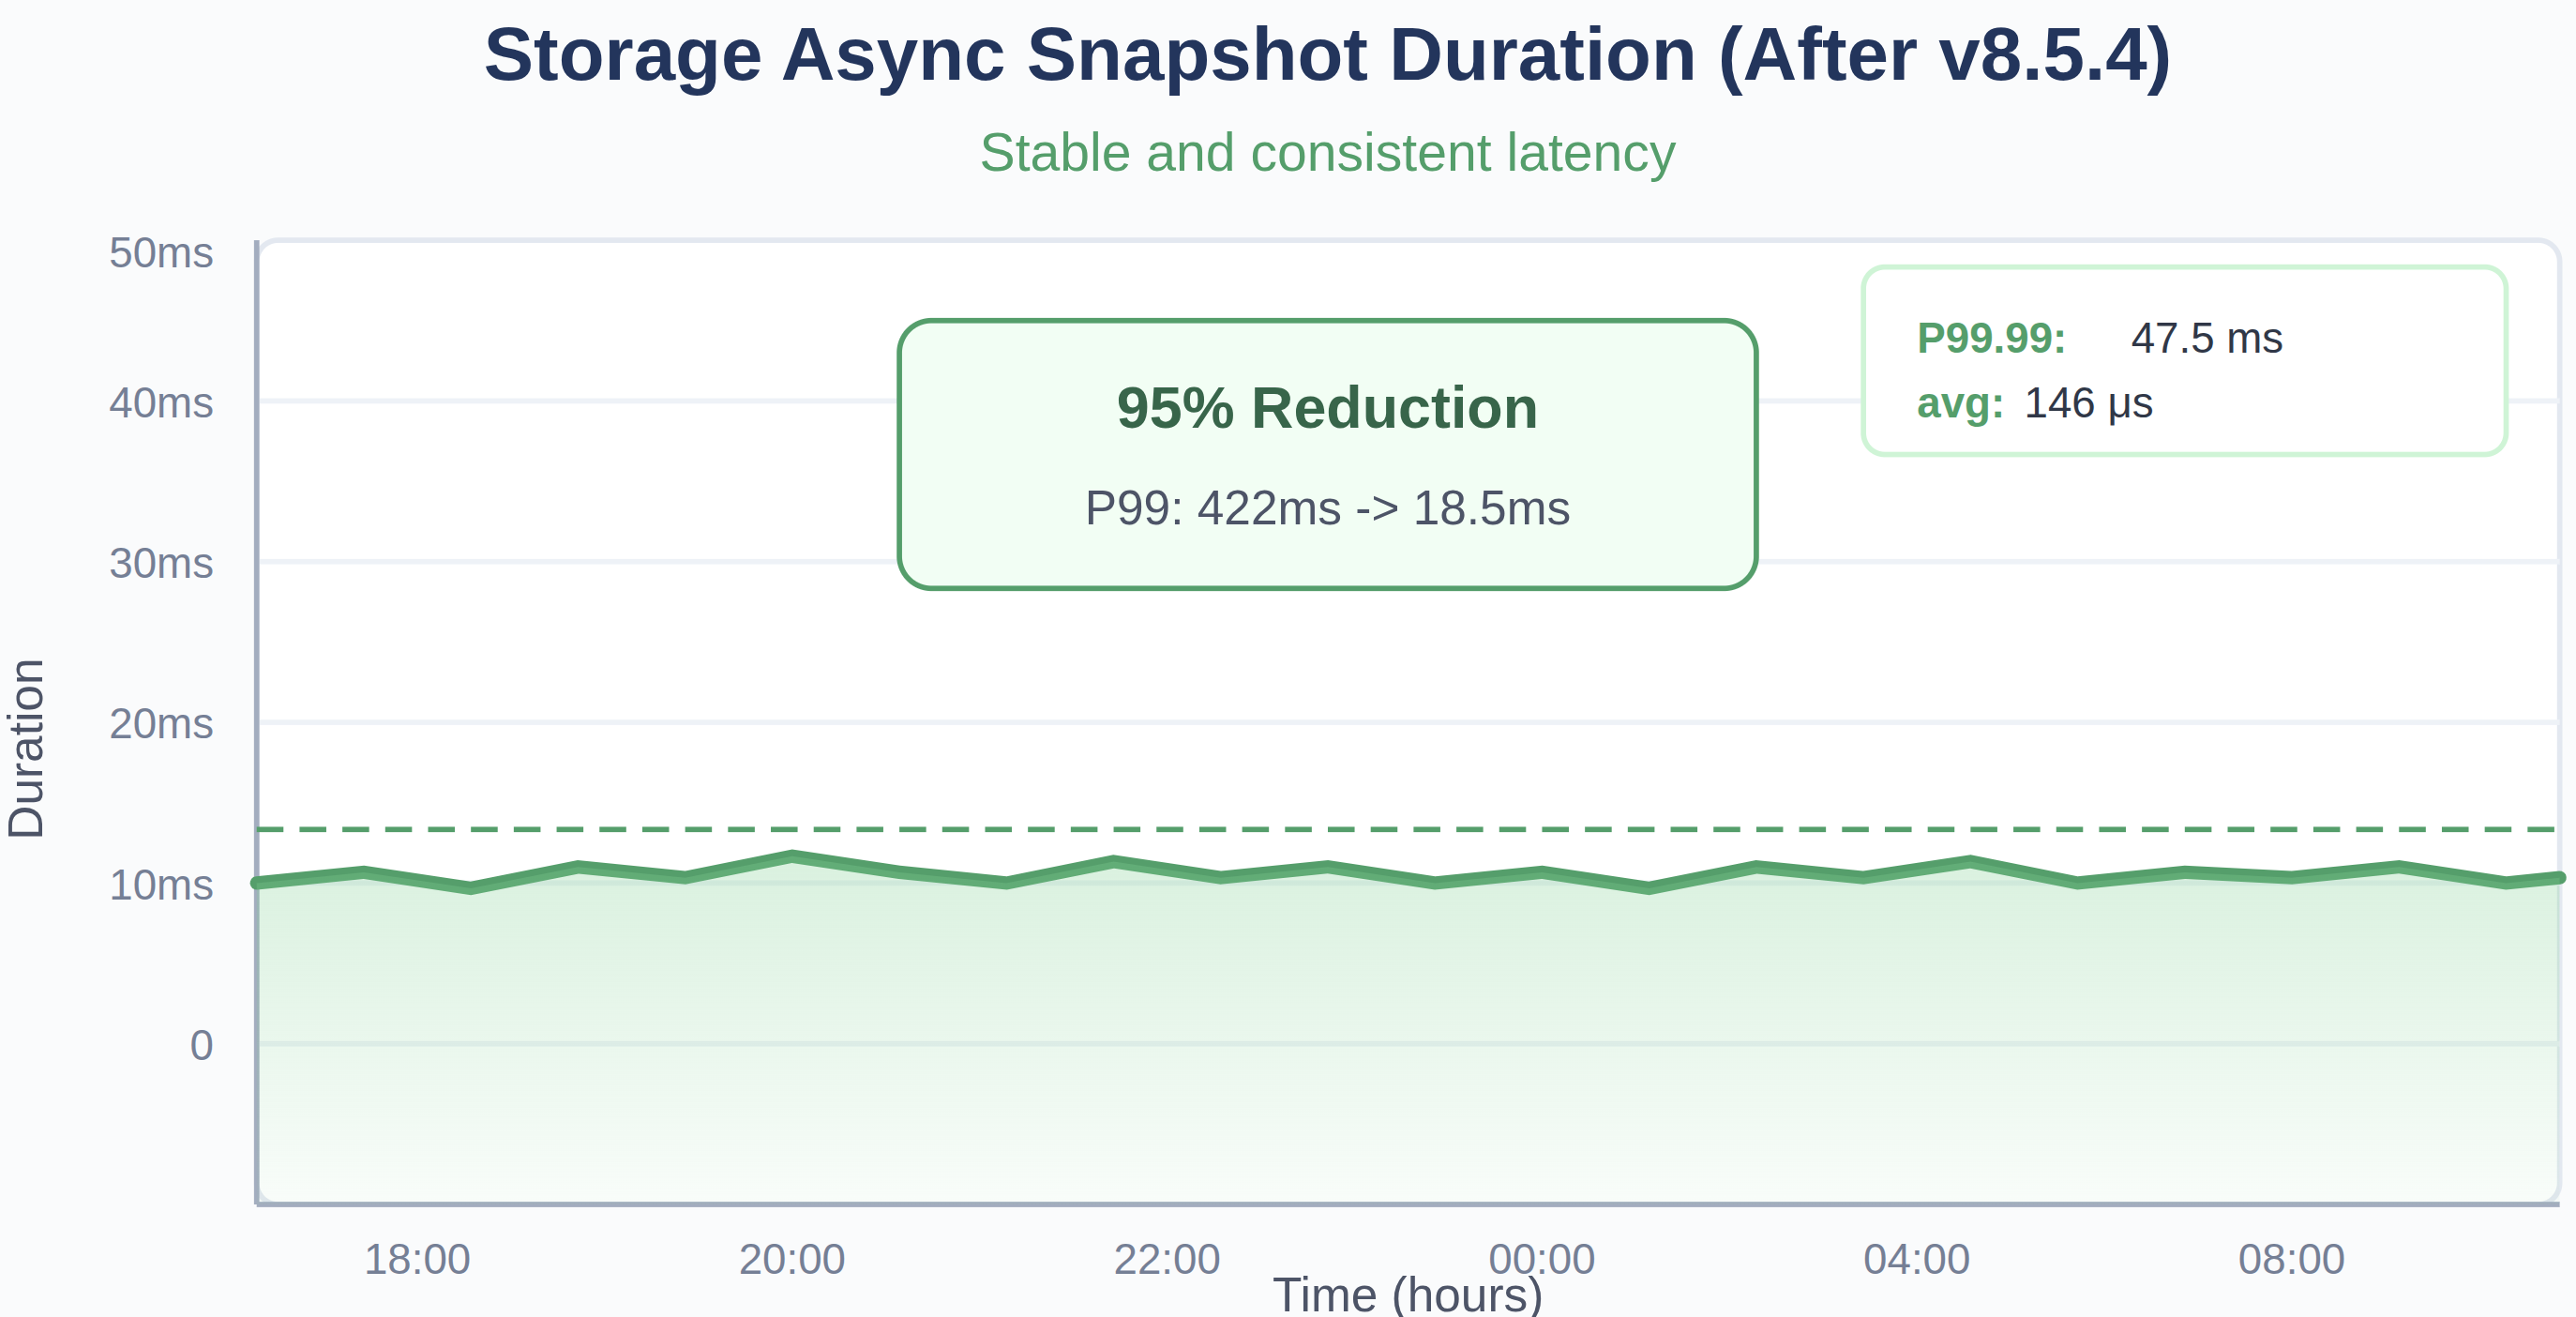
Fig. 8: Storage async snapshot duration before and after upgrading the TiDB 8.5.4.
System-Wide Improvements in TiDB 8.5
The improvements are not incremental tweaks but fundamental engineering enhancements that address the root causes of performance variability. Key Engineering Improvements:
- TiDB Layer: Memory allocation/Goroutine optimization, Coprocessor/DistSQL worker optimization, ART membuffer, for additional improvements, see the release notes.
- TiKV Layer: Async snapshot optimization, SST ingestion without write pauses, for additional improvements, see the release notes.
TiDB v8.5 is not “one magic feature”. It’s the result of applying a consistent performance strategy across the stack. More importantly, these optimizations and improvements are enabled by default in the TiDB v8.5.4 kernel, allowing the vast majority of OLTP scenarios to benefit from them.
We now turn to production data to see these improvements in action.
TiDB 8.5.4 Production Results
The true measure of any optimization is its impact in production environments. These results show how TiDB 8.5 can reduce P999 latency in distributed databases under real production workloads. All three serve mission-critical online trading services — workloads where tail latency directly affects trading success rates and business outcomes.
Production Cluster Profiles
Understanding these results requires understanding the workloads. Here is a summary of the three production clusters:
| Case 1 (150K QPS) | Case 2 (155K QPS) | Case 3 (31K QPS) | |
| Environment | 20+ TiDB/TiKV/PD 32C nodes 24h Production metric | 20+ TiDB/TiKV/PD 32C nodes 24h Production metric | 10+ TiDB/TiKV/PD 32C nodes 24h Production metric |
| Workload type | Mixed read/write, online trading platform | Mixed read/write, online saas services | Mixed read/write, mission-critical online services |
| Read/write ratio | Both heavy — tens of thousands of rows changed or updated per second | Both heavy — similar intensity to Case 1 | Moderate load, but with similar latency-sensitive access patterns |
| Data volume per TiKV store | ~4 TiB | ~4 TiB | Smaller, but non-trivial |
| SST file count per node | ~200K | ~200K | Lower |
| Cluster scale | 100+ TiKV nodes, ~10K region peers per store | 100+ TiKV nodes, ~10K region peers per store | Smaller cluster |
| Transaction pattern | Standard OLTP transactions | Large transactions (non-transactional DML batches with 200K+ rows per batch) | Standard OLTP transactions |
| Latency sensitivity | Critical — read latency spikes directly affect trading success ratio | Critical — same business impact | Critical — same business impact |
Why the improvements vary across cases: Case 1 and Case 2 are large-scale, high-QPS clusters where all the optimizations are active simultaneously. Case 3 has lower QPS and a smaller cluster, so the absolute latency numbers were already better — but the relative slow query reduction is the most dramatic.
P999 Latency Improvements
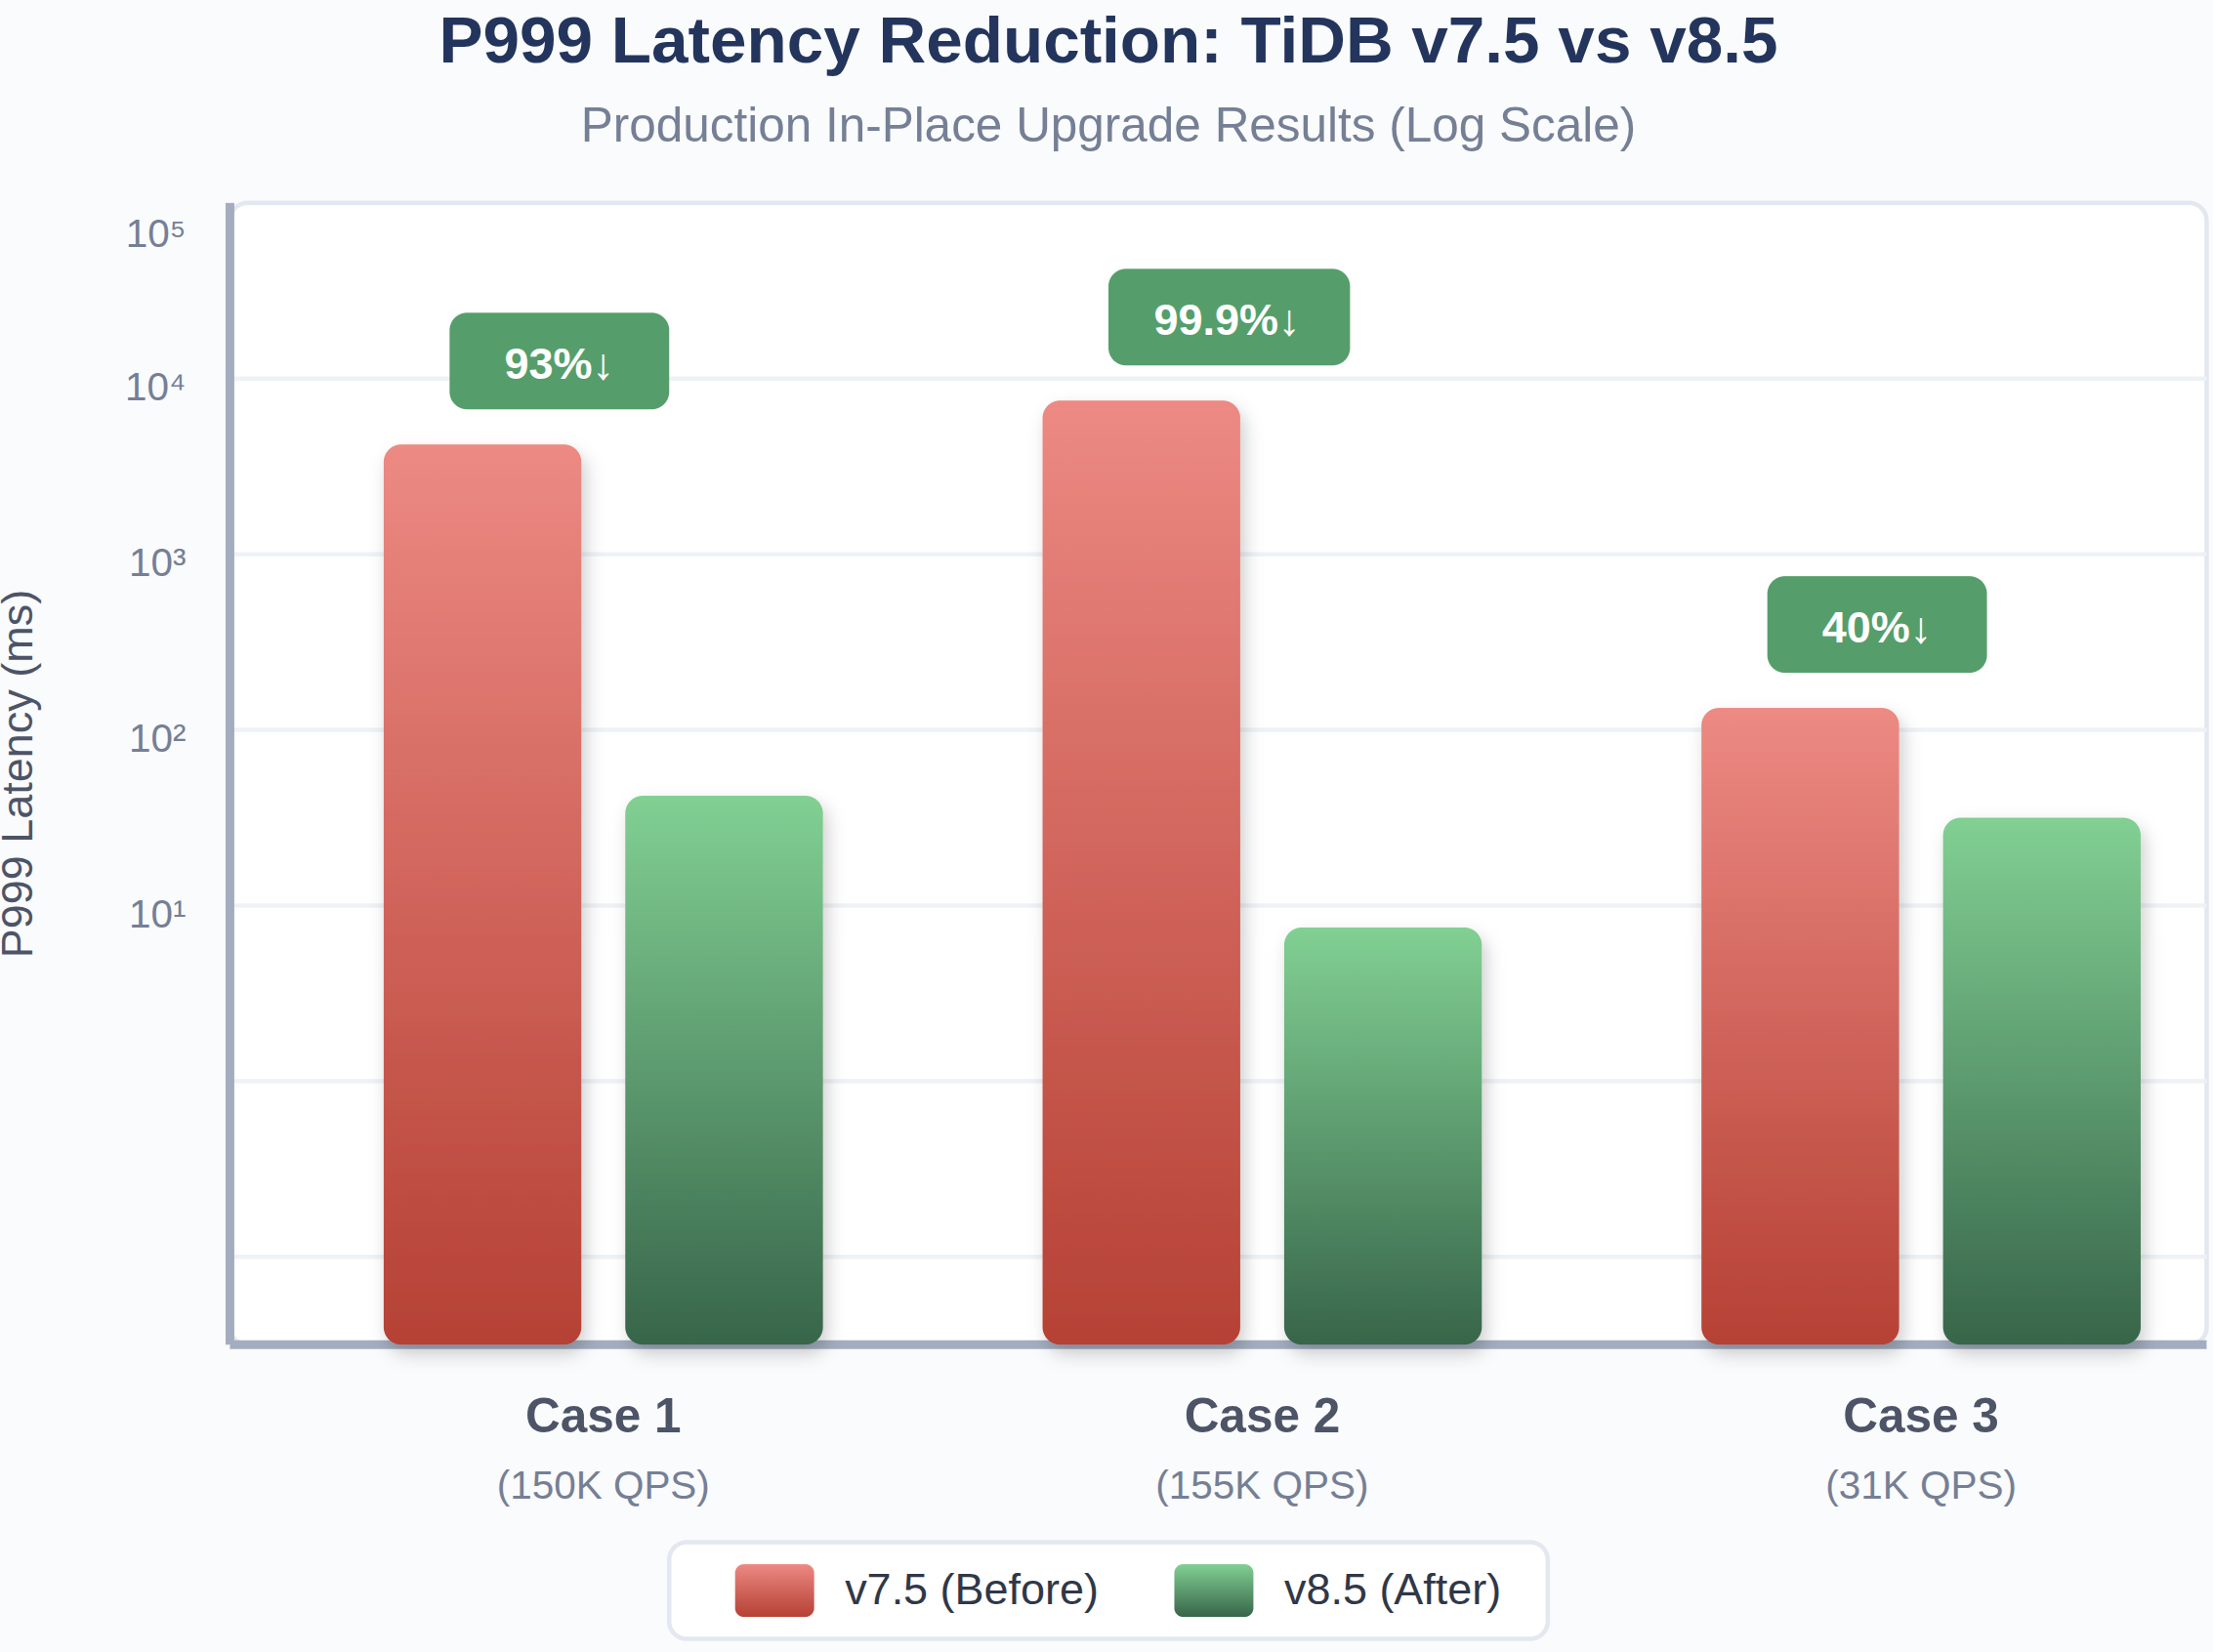
Fig. 9: P999 Latency reduction from v7.5 to v8.5
In one production cluster, P999 dropped from minute-level to sub-100ms.
Resource Efficiency Gains
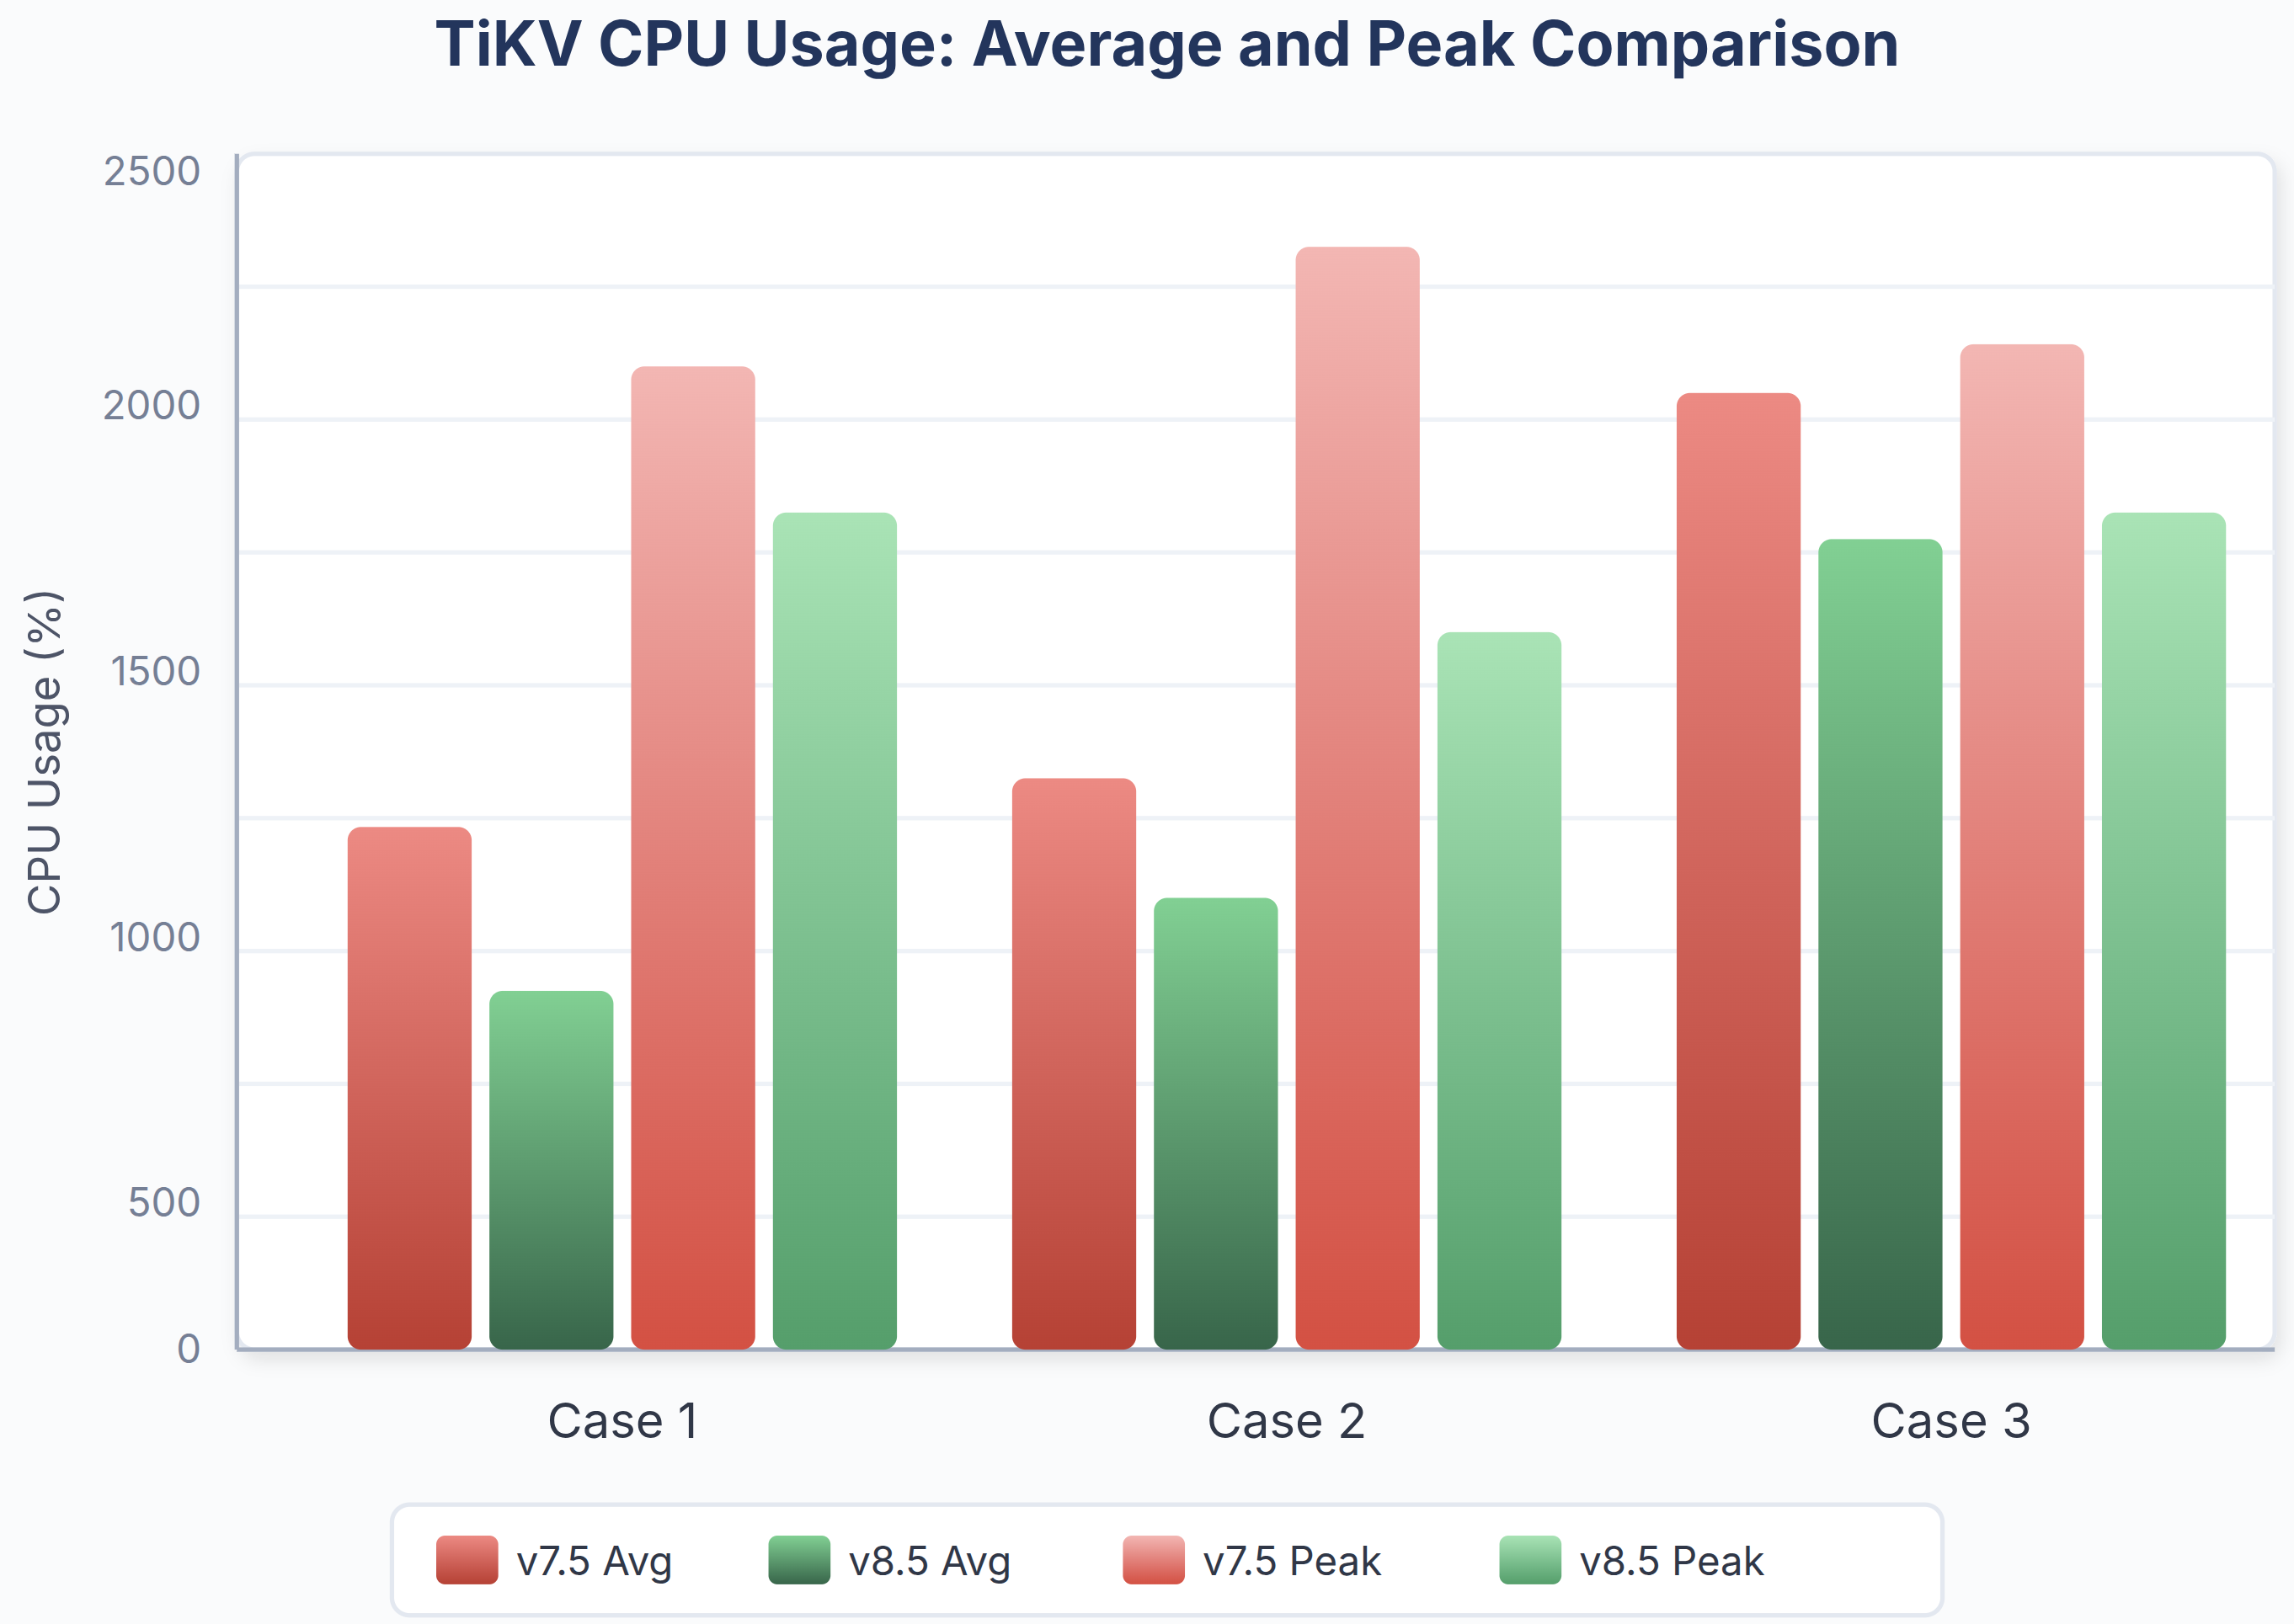
Fig. 10: Comparison between average and peak TiKV CPU usage in v7.5 and v8.5
Slow Query Elimination
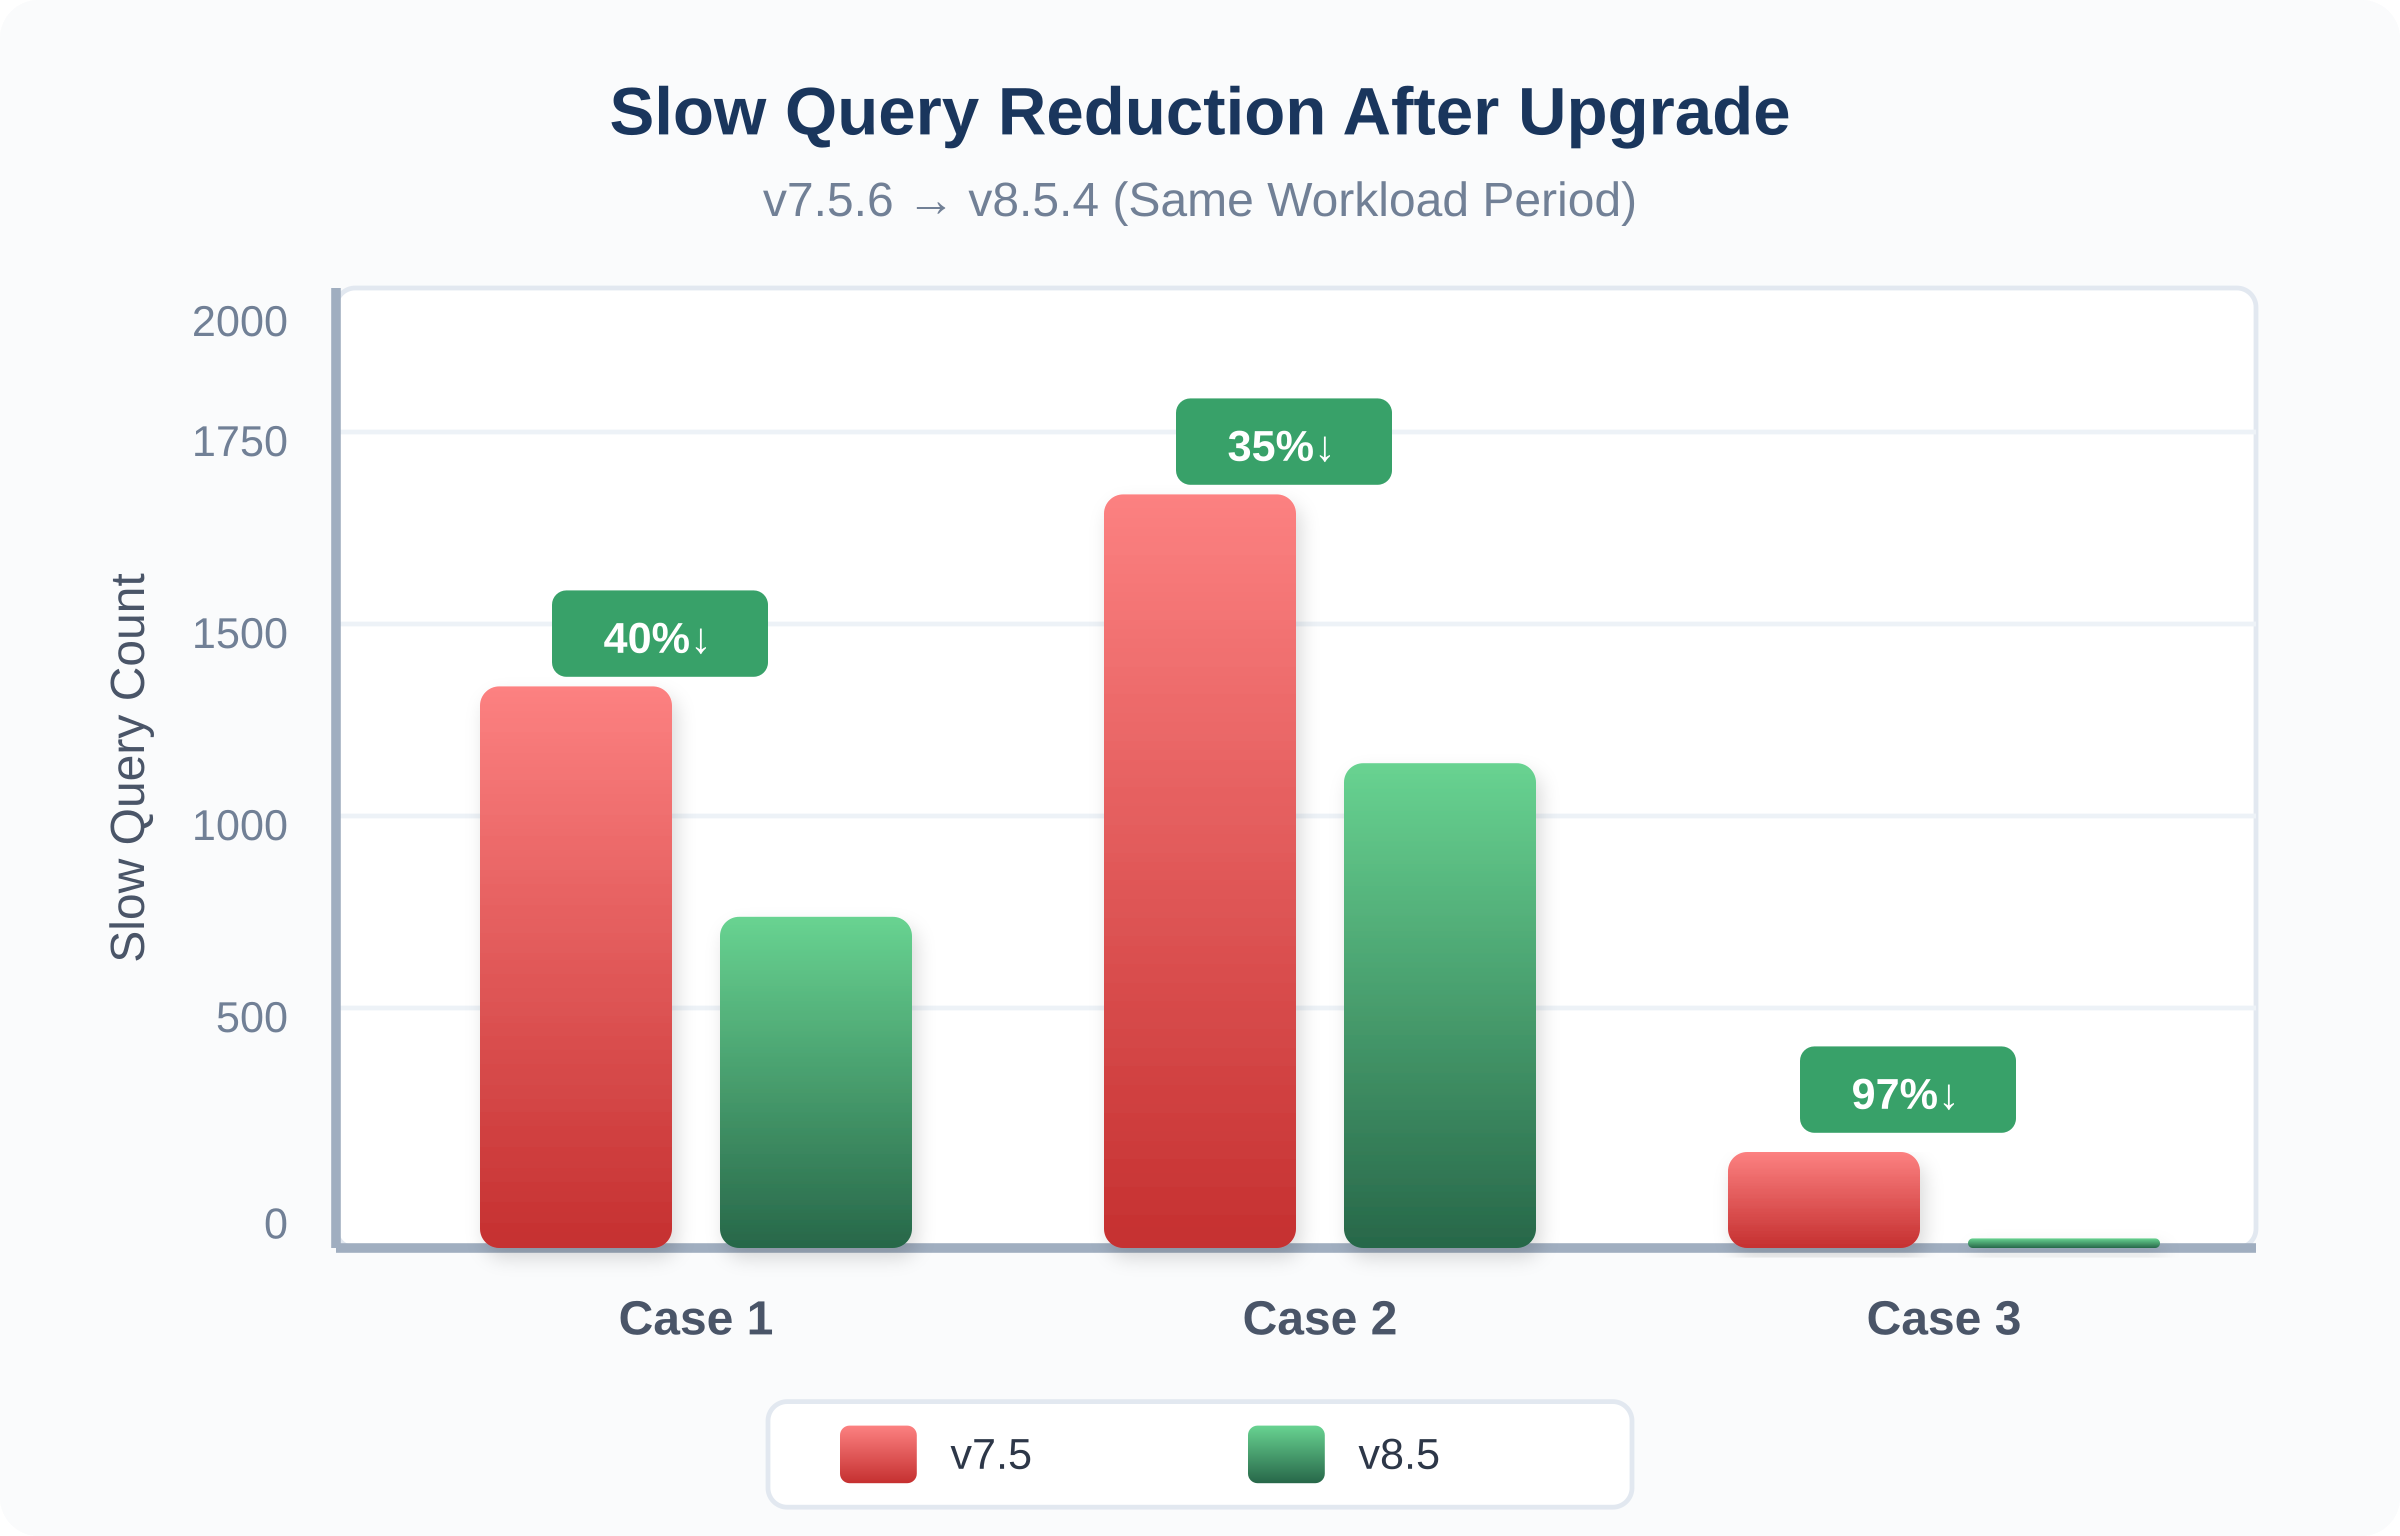
Fig. 11: Slow query reduction across the 3 cases and two versions
>90% Slow Query Reduction (Case 3).
DML Operation Performance
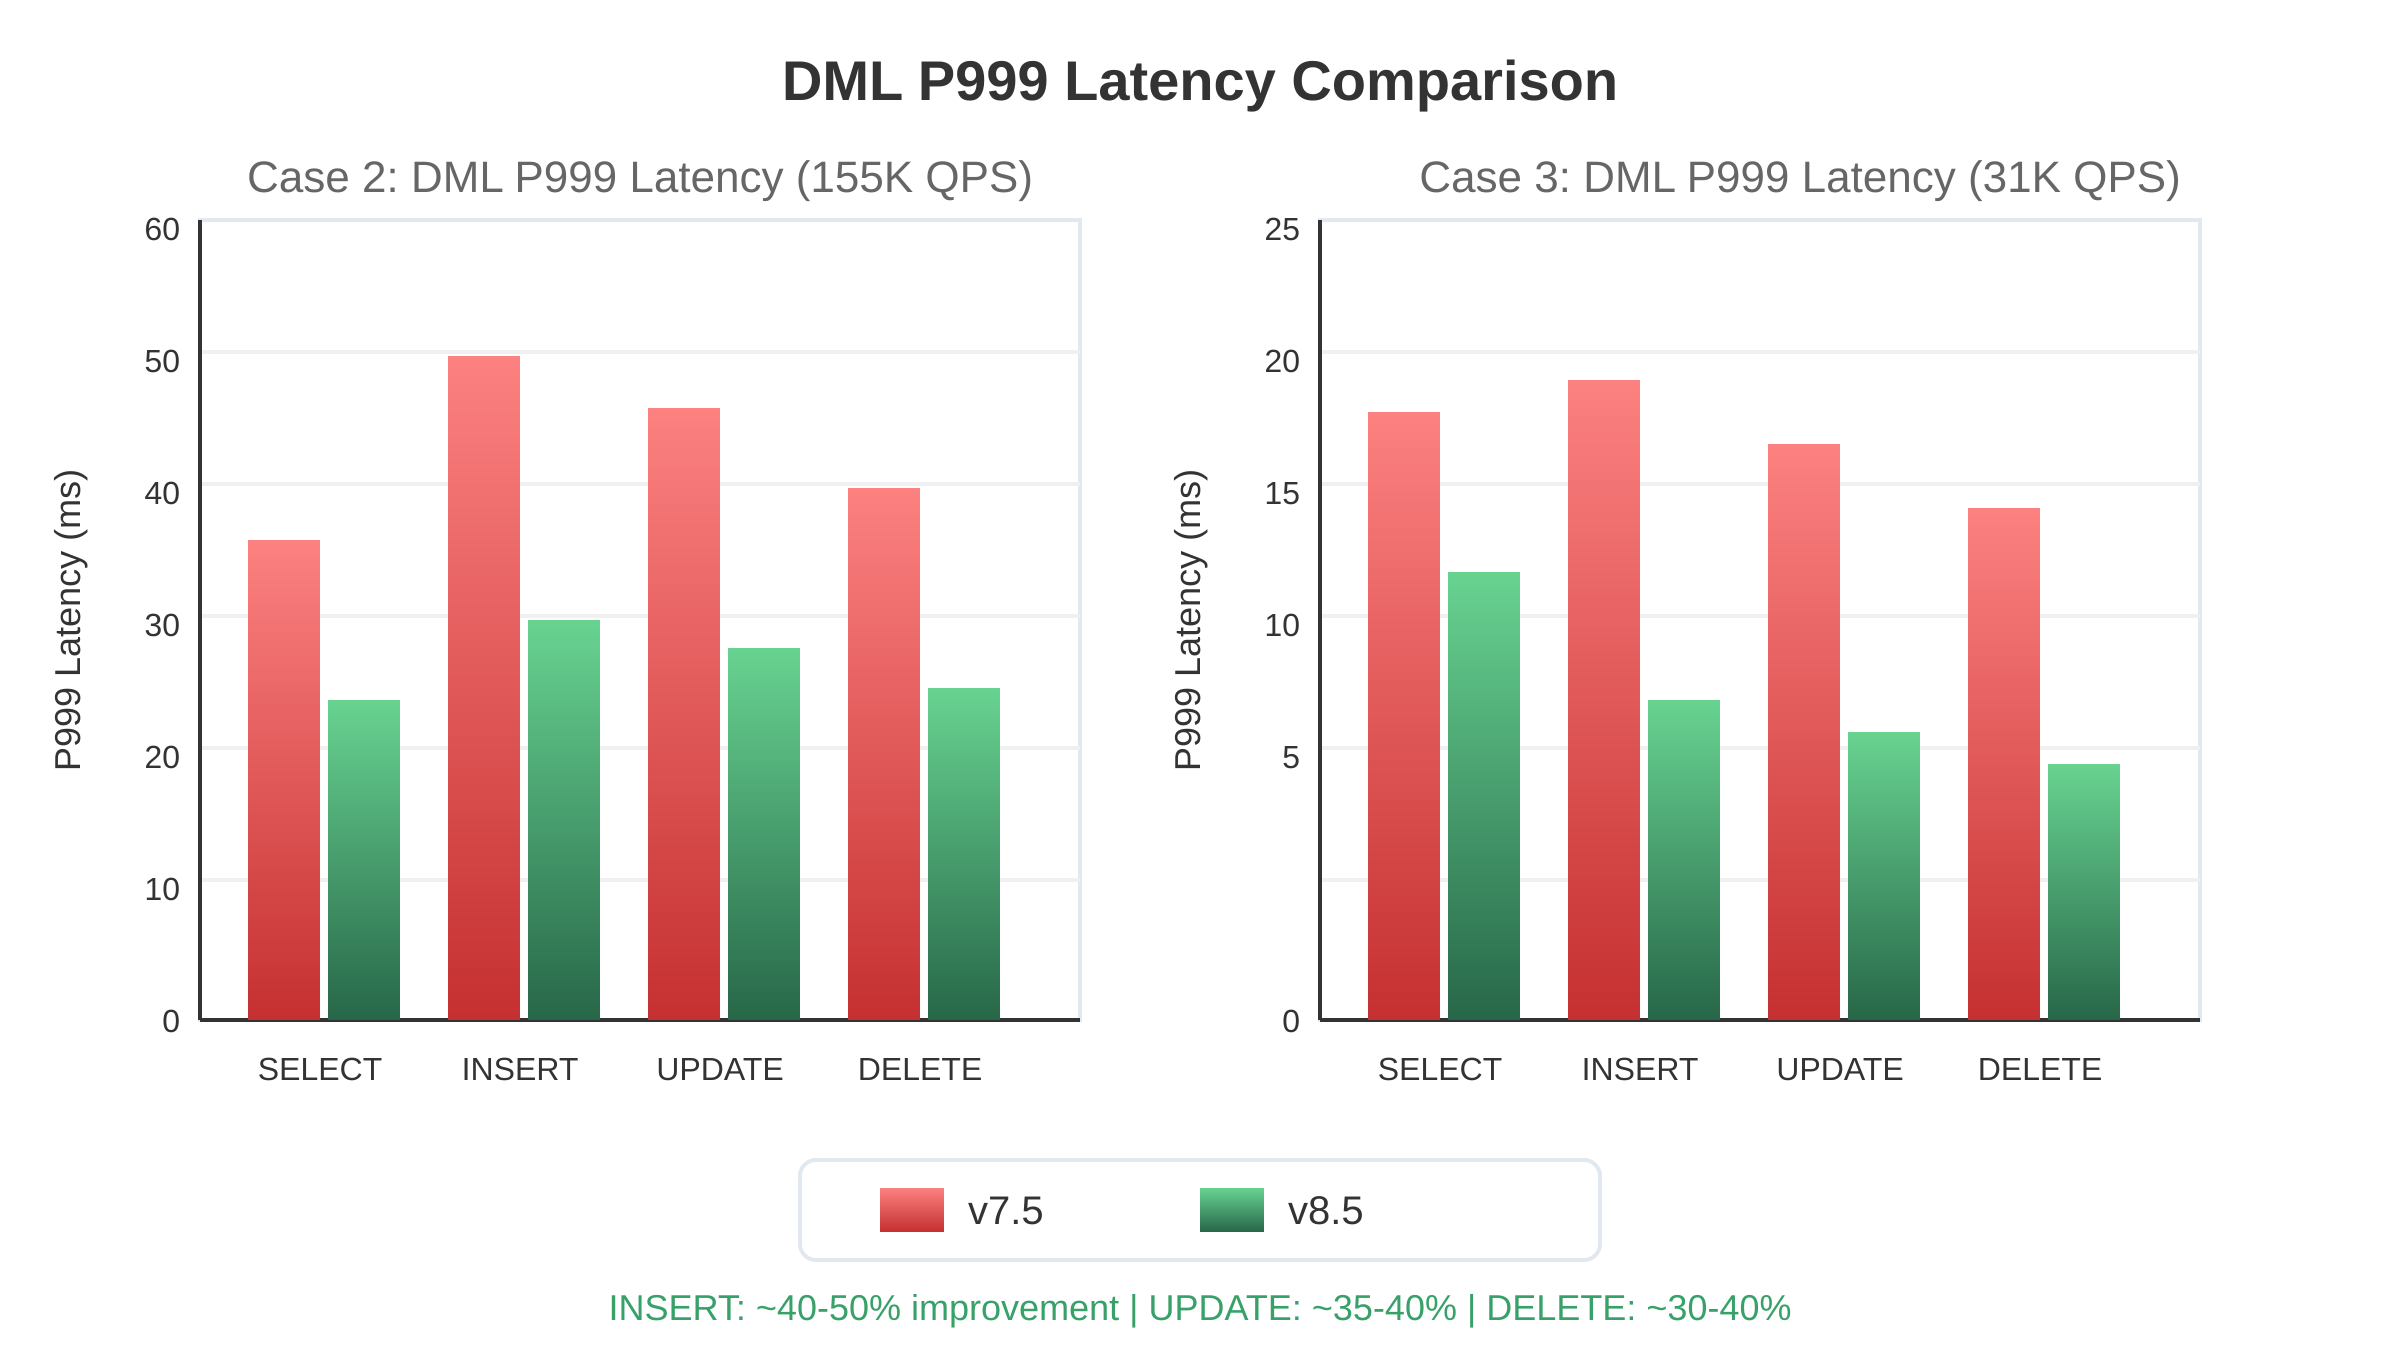
Fig. 12: DML P999 latency comparison across both versions .
Extending Tail Latency Improvements in TiDB 8.5.5
The improvements in TiDB 8.5 focus on eliminating latency variance by removing stalls and reducing overhead across the request path.
In TiDB 8.5.5, we build on this foundation—not by introducing new sources of variance reduction, but by further shortening the critical path through better execution locality and fewer network round trips.
These enhancements follow the same principles outlined earlier: primarily Remove (eliminating unnecessary coordination) and Reorder (moving work closer to where data resides).
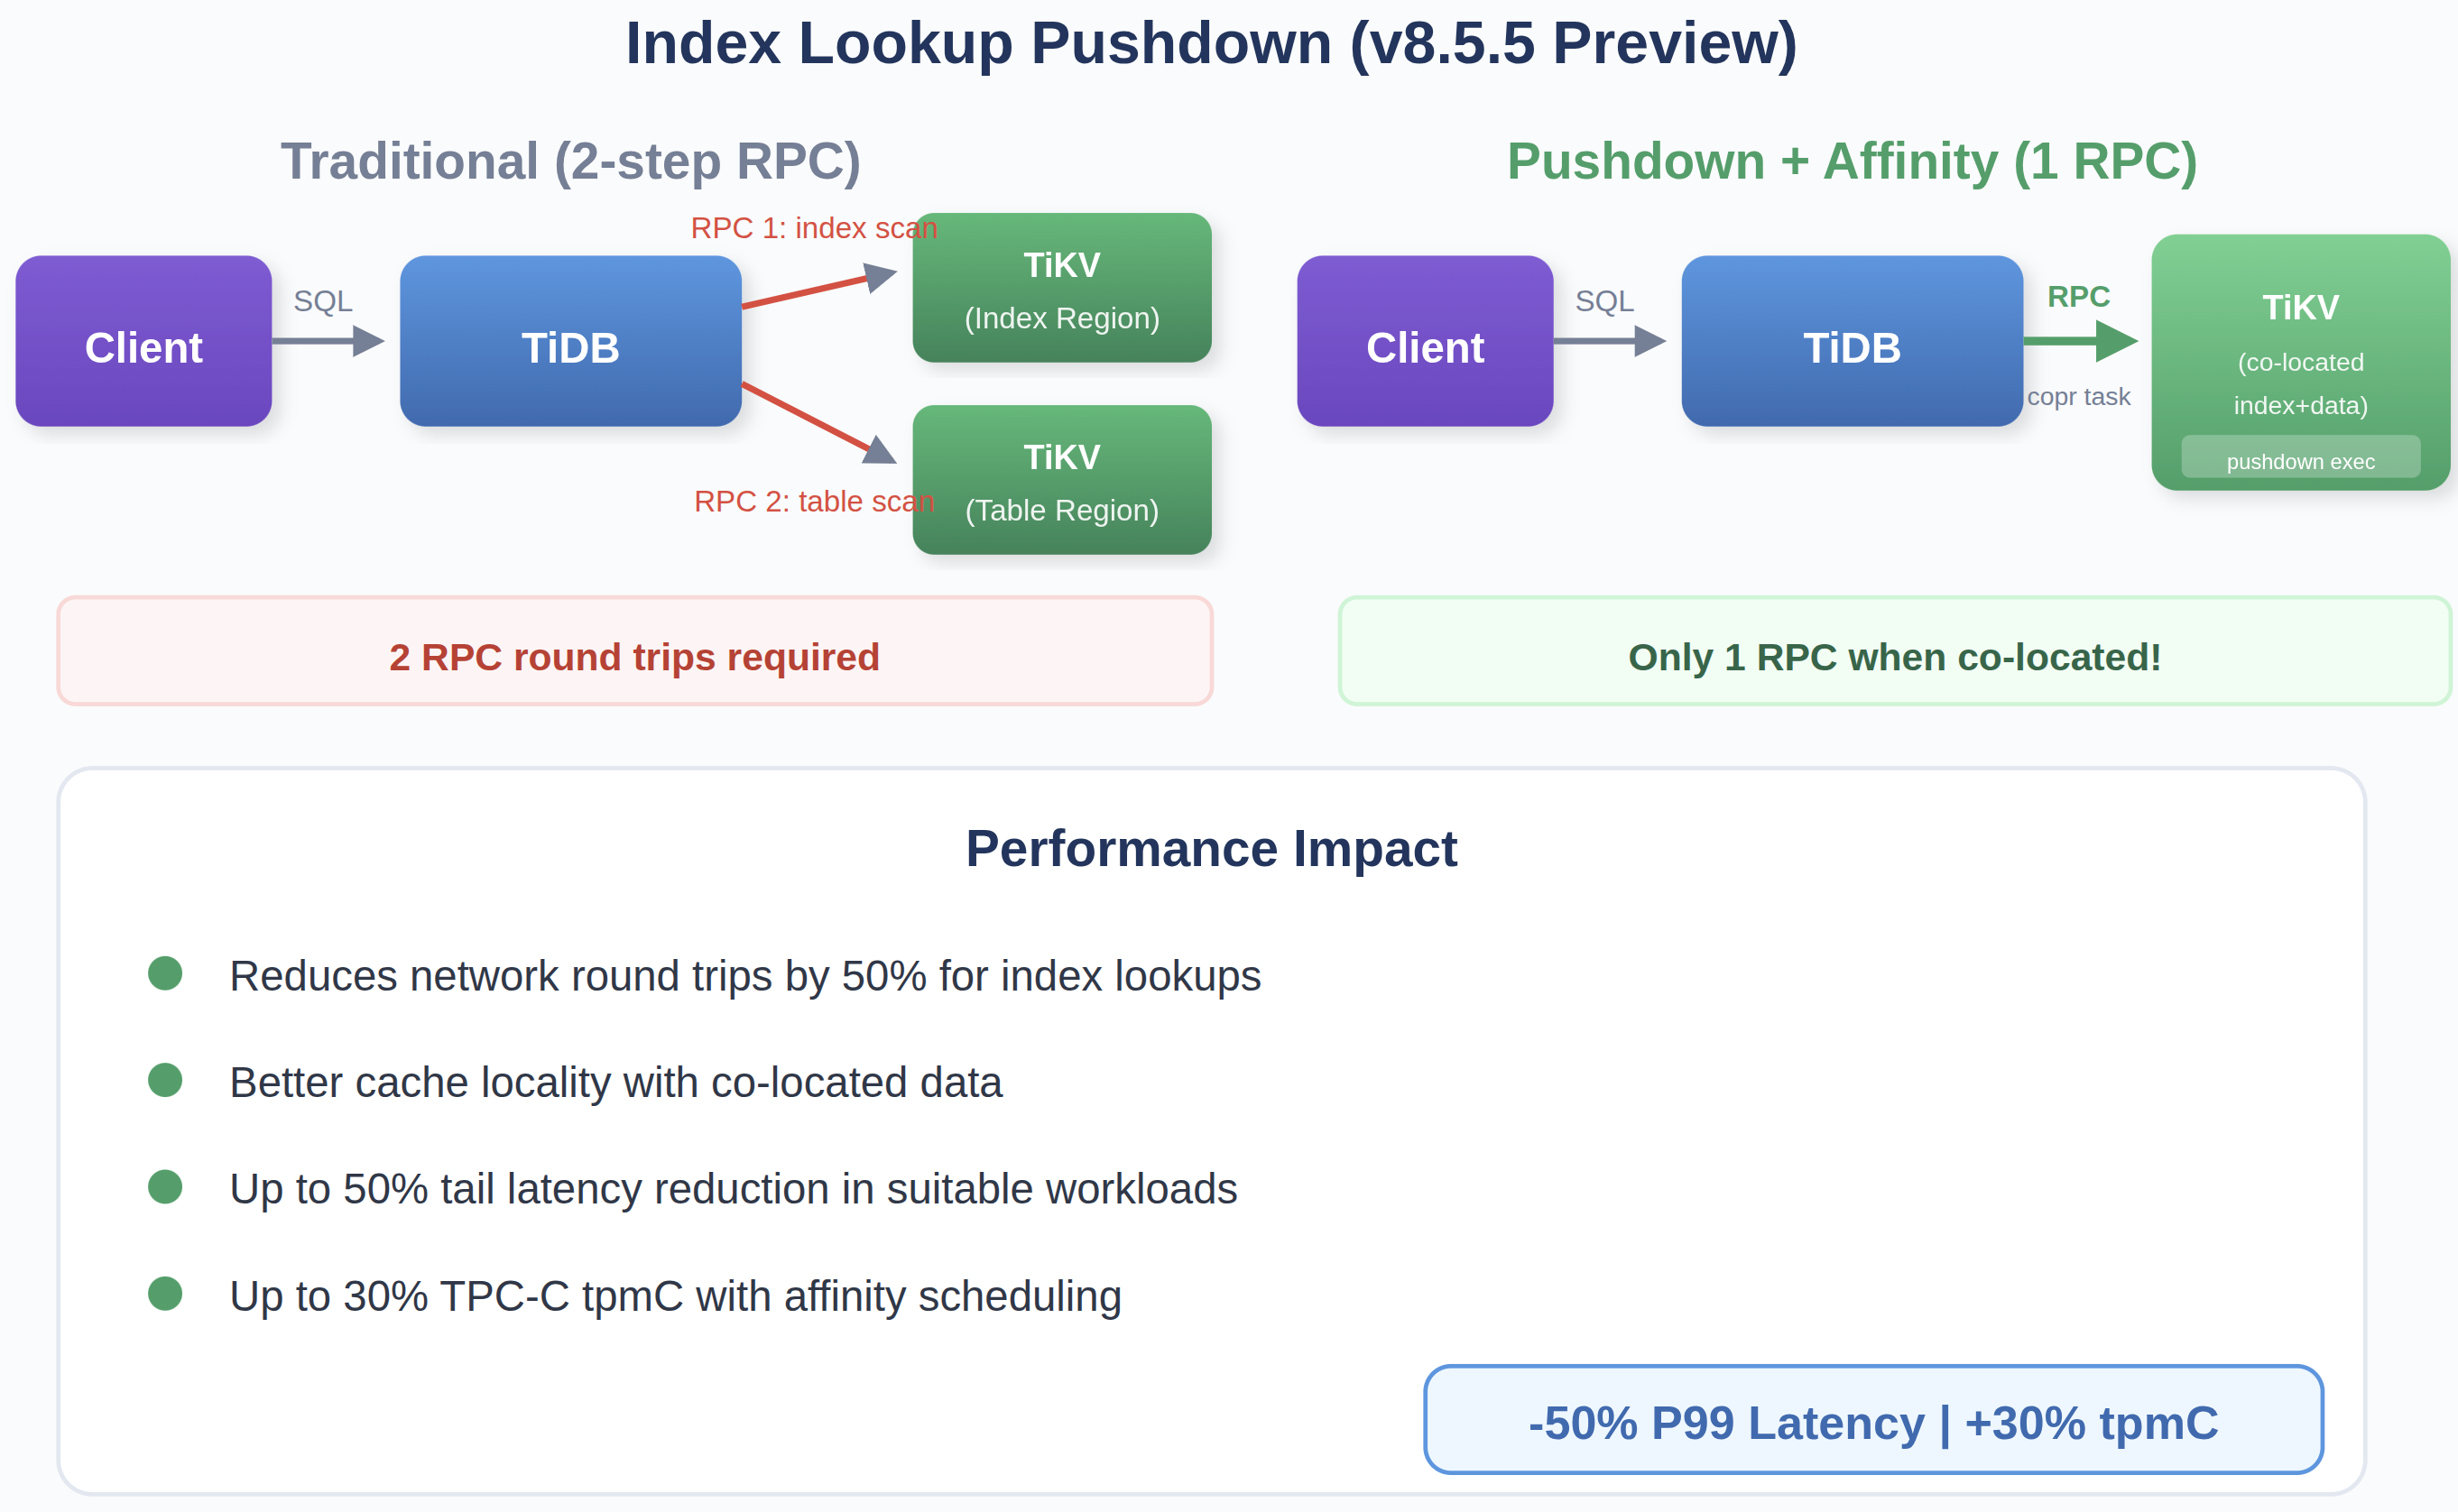
Fig. 13: Cutting index lookup from two network round trips to one through pushdown execution and data locality
Index Lookup Pushdown
When index and table data are co-located, an index lookup can now be executed in a single coprocessor RPC instead of two.
This removes an entire network round trip from the critical path, reducing both latency and coordination overhead for lookup-heavy queries.
Data Affinity Scheduling
Data affinity scheduling increases the likelihood that related data—such as table rows and their corresponding index entries, or partition-level working sets—remains co-located within the same TiKV node.
This improves pushdown hit rates and enables more queries to execute with fewer coordination steps, further reducing latency under load.
Impact
In suitable workloads, these optimizations provide additional improvements on top of the gains from TiDB 8.5. Internal testing shows:
- Up to 20–30% further tail latency reduction
- Up to 20% improvement in TPMC benchmarks
Start with TiDB 8.5 today and see how far you can push OLTP performance with upcoming TiDB 8.5.5 enhancements.
Experience modern data infrastructure firsthand.


TiDB Cloud Dedicated
A fully-managed cloud DBaaS for predictable workloads
TiDB Cloud Starter
A fully-managed cloud DBaaS for auto-scaling workloads