

Have you ever seen two nearly identical SQL statements, differing only in date parameters or function variations, return similar results but with wildly different performance, sometimes by factors of 10 or 100? In real-world scenarios, we typically run the `EXPLAIN` statement to examine changes in the execution plan.
But what if the execution plan doesn’t change? Then what? That’s where EXPLAIN ANALYZE comes in. It reveals the real runtime behavior of each operator, not just the plan.
In a previous blog, we explored the observability tools needed to detect and eliminate unused or inefficient indexes in TiDB, improving performance and stability. This post will combine real-world cases and common issues to explore how to leverage operator execution information for more precise analysis and diagnosis of SQL performance.
TiDB Observability: Operator Execution Information Introduction
Usually we can use the explain analyze statement to obtain operator execution information. Explain analyze will actually execute the corresponding SQL statement, while capturing its runtime execution information, and return it together with the execution plan. The recorded information includes: actRows , execution info , memory , and disk .
| Attribute Name | Meaning |
| actRows | Number of rows output by the operator. |
| execution info | Execution information of the operator. time represents the total wall time from entering the operator to leaving the operator, including the total execution time of all sub-operators. If the operator is called many times by the parent operator (in loops), then the time refers to the accumulated time. loops is the number of times the current operator is called by the parent operator. |
| memory | Memory space occupied by the operator. |
| disk | Disk space occupied by the operator. |
For explanations of `execution info` across different operators, refer to the TiDB documentation. Developers refined these metrics through extensive troubleshooting of performance issues, making them essential reading for anyone aiming to deeply understand TiDB SQL performance diagnostics.
Sometimes SQL performance issues are intermittent, and this increases the difficultly of using EXPLAIN ANALYZE directly. At this time, you can quickly locate and retrieve detailed execution information for problematic SQL statements through the slow log query page of TiDB Dashboard.
TiDB Observability Case Studies
Next, we will explore related problems through specific real-world examples. These examples include:
- Investigating query latency jitter
- Understanding operator concurrency
- Why did MAX() take 100ms while MIN() took 8 seconds?
Please note that developers sourced most execution plans in the following cases from production environments (desensitized for privacy).
Query Latency Jitter
Intermittent query latency jitter is one of the most common performance issues. If the slow query log can pinpoint the specific SQL statements causing performance fluctuations, further analysis of their operator execution information often reveals the root cause and provides actionable optimization clues.
Case
Consider a customer’s point query latency jitter issue, where delays occasionally exceeded 2 seconds. Using the slow query log, we located the operator execution metrics for one such problematic query:
mysql> explain analyze select * from t0 where col0 = 100 and col1 = 'A';
+---------------------+---------+---------+-----------+---------------------------------------------+---------------------------------------------------------------------------------------------------------------------------------------------------------------------------------------------------------------------------------------------------------------------------------------------------------------------------------------------------------------------------------+---------------+---------+------+
| id                  | estRows | actRows | task      | access object                               | execution info                                                                                                                                                                                                                                                                                                                                                                  | operator info | memory  | disk |
+---------------------+---------+---------+-----------+---------------------------------------------+------------------------------------------------------------------------------------------------------------------------------------------------------------------------------------------------------------------------------------------------------------------------------------------------------------------+--------------------------------------------------------------+---------------+---------+------+
| Point_Get_1         | 1       | 1       | root      | table:t0, index:uniq_col0_col1              | time:2.52s, loops:2, ResolveLock:{num_rpc:1, total_time:2.52s}, Get:{num_rpc:3, total_time:2.2ms}, txnNotFound_backoff:{num:12, total_time:2.51s}, tikv_wall_time: 322.8us, scan_detail: {total_process_keys: 2, total_process_keys_size: 825, total_keys: 9, get_snapshot_time: 18us, rocksdb: {delete_skipped_count: 3, key_skipped_count: 14, block: {cache_hit_count: 16}}} | N/A           | N/A     | N/A  |
+---------------------+---------+---------+-----------+---------------------------------------------+------------------------------------------------------------------------------------------------------------------------------------------------------------------------------------------------------------------------------------------------------------------------------------------------------------------+--------------------------------------------------------------+---------------+---------+------+
Analysis
First, we observe that the query involves only a Point_Get_1 operator, with an execution time of 2.52s recorded in execution info. This indicates that the entire execution duration is captured accurately.
Upon closer inspection of the execution info, we note the presence of a ResolveLock entry. Details reveal that this operation consumed 2.52s in total, meaning nearly all query time was spent resolving locks. In contrast, the actual Get operation took only 2.2ms, confirming that data access was negligible.
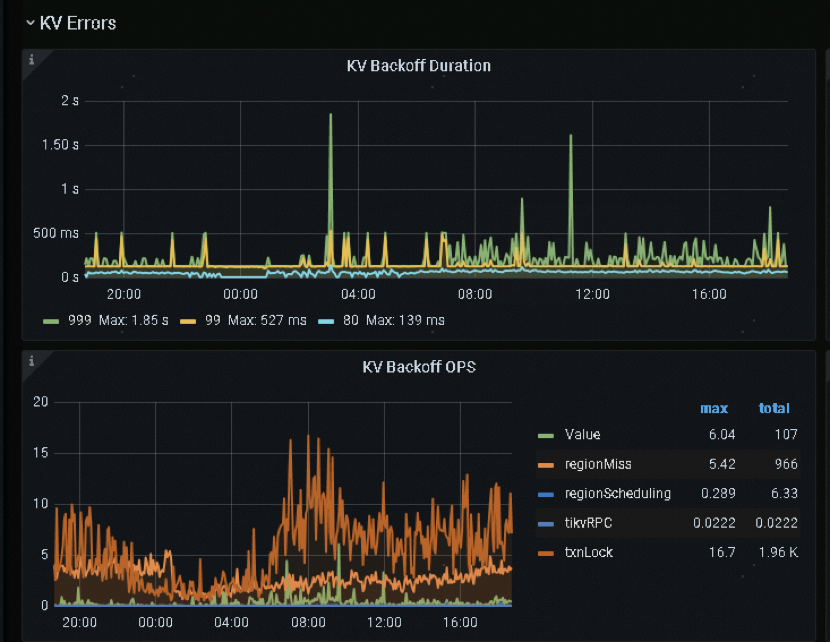
Additionally, a txnNotFound_backoff entry highlights retries triggered by stale transactions. Specifically, 12 retries occurred, cumulatively lasting 2.51s (aligning closely with the ResolveLock duration of 2.52s).
This leads us to hypothesize: the point query likely encountered locks from stale transactions. During the ResolveLock phase, the system detected expired locks, initiating a cleanup process. This lock resolution overhead caused high query latency.
To validate this hypothesis, we can cross-reference monitoring data, as shown in the below image:
Operator Concurrency in TiDB
In TiDB, we can adjust the execution concurrency of operators through system variables to ultimately tune SQL performance. Operator concurrency significantly impacts execution efficiency. For example, with the same number of coprocessor tasks, increasing concurrency from 5 to 10 may nearly double performance—though at the cost of higher resource utilization. Execution information helps us understand the actual concurrency of operators, laying the groundwork for deeper performance diagnostics. Let’s examine a real-world case.
Case
The system was configured with:
tidb_executor_concurrency= 5tidb_distsql_scan_concurrency= 15
What are the actual execution concurrencies for the cop_task and tikv_task in the following execution plan?
mysql> explain analyze select * from t0 where c like '2147%';
+-------------------------------+---------+---------+-----------+-------------------------------+-----------------------------------------------------------------------------------------------------------------------------------------------------------------------------------------------------------------------------------------------------------------------------------------------------------------------------------------------------------------------------------------------------------------------------------------------------------------------+-----------------------------------------+---------+------+
| id                            | estRows | actRows | task      | access object                 | execution info                                                                                                                                                                                                                                                                                                                                                                                                                                                        | operator info                           | memory  | disk |
+-------------------------------+---------+---------+-----------+-------------------------------+-----------------------------------------------------------------------------------------------------------------------------------------------------------------------------------------------------------------------------------------------------------------------------------------------------------------------------------------------------------------------------------------------------------------------------------------------------------------------+-----------------------------------------+---------+------+
| IndexLookUp_10                | 3.82    | 99      | root      |                               | time:2.83ms, loops:2, index_task: {total_time: 733.8µs, fetch_handle: 727.9µs, build: 806ns, wait: 5.14µs}, table_task: {total_time: 1.96ms, num: 1, concurrency: 5}, next: {wait_index: 821µs, wait_table_lookup_build: 108.2µs, wait_table_lookup_resp: 1.85ms}                                                                                                                                                                                                     |                                         | 41.0 KB | N/A  |
| ├─IndexRangeScan_8(Build)     | 3.82    | 99      | cop[tikv] | table:t0, index:idx_c(c)      | time:719.1µs, loops:3, cop_task: {num: 1, max: 650µs, proc_keys: 99, rpc_num: 1, rpc_time: 625.7µs, copr_cache_hit_ratio: 0.00, distsql_concurrency: 15}, tikv_task:{time:0s, loops:3}, scan_detail: {total_process_keys: 99, total_process_keys_size: 18810, total_keys: 100, get_snapshot_time: 102µs, rocksdb: {key_skipped_count: 99, block: {cache_hit_count: 3}}}                                                                                               | range:["2147","2148"), keep order:false | N/A     | N/A  |
| └─TableRowIDScan_9(Probe)     | 3.82    | 99      | cop[tikv] | table:t0                      | time:1.83ms, loops:2, cop_task: {num: 4, max: 736.9µs, min: 532.6µs, avg: 599µs, p95: 736.9µs, max_proc_keys: 44, p95_proc_keys: 44, rpc_num: 4, rpc_time: 2.32ms, copr_cache_hit_ratio: 0.00, distsql_concurrency: 15}, tikv_task:{proc max:0s, min:0s, avg: 0s, p80:0s, p95:0s, iters:5, tasks:4}, scan_detail: {total_process_keys: 99, total_process_keys_size: 22176, total_keys: 99, get_snapshot_time: 217.3µs, rocksdb: {block: {cache_hit_count: 201}}}      | keep order:false                        | N/A     | N/A  |
+-------------------------------+---------+---------+-----------+-------------------------------+-----------------------------------------------------------------------------------------------------------------------------------------------------------------------------------------------------------------------------------------------------------------------------------------------------------------------------------------------------------------------------------------------------------------------------------------------------------------------+-----------------------------------------+---------+------+
3 rows in set (0.00 sec)
Analysis
We just used this example to explain the relationship between cop_task and tikv_task items in the execution information and the actual execution concurrency of the cop task.
Cop_task vs tikv_task
First, it’s critical to clarify that the xxx_task entries in execution info are not equivalent to the “task” column in execution plans.
For example, in the execution plan, the category of the task column is “root” , “cop [tikv]” , etc. It describes which component the operator actually executes in (such as TiDB, TiKV, or TiFlash). Additionally, it further explains its communication protocol type with the storage engine (such as Coprocessor, Batch Coprocessor, or MPP).
In contrast, the various tasks in execution info are more about breaking down operator execution information from different dimensions. This allows users to quickly locate potential performance issues and verify each other through information from different dimensions. Specifically:
- tikv_task describes the overall execution of a specific TiKV operator;
- cop_task describes the execution of the entire RPC task, which includes tikv_task . For example, a cop_task may contain two operators, tableScan + Selection. Each operator has its own tikv_task information to describe its execution. cop_task describes the execution information of the entire RPC request, which covers the execution time of these two operators.
Similarly, in an MPP query, the tiflash_task statistic in execution info describes the overall execution of a particular TiFlash operator:
+------------------------------+-------------+----------+--------------+----------------+-----------------------------------------------------------------------------------------------------------------------------------------------------------------------------------------------------------------------------------------------------------------------------------------------------------------------------------------------------------------------------------------------------------------------------------------------------------------------------------------------------------------------------------------------------------------------------------------------------------------------------------------+----------------------------------------------------+-----------+---------+
| id                           | estRows     | actRows  | task         | access object  | execution info                                                                                                                                                                                                                                                                                                                                                                                                                                                                                                                                                                                                                          | operator info                                      | memory    | disk    |
+------------------------------+-------------+----------+--------------+----------------+-----------------------------------------------------------------------------------------------------------------------------------------------------------------------------------------------------------------------------------------------------------------------------------------------------------------------------------------------------------------------------------------------------------------------------------------------------------------------------------------------------------------------------------------------------------------------------------------------------------------------------------------+----------------------------------------------------+-----------+---------+
| HashAgg_22                   | 1.00        | 1        | root         |                | time:17ms, open:1.92ms, close:4.83µs, loops:2, RU:1832.08, partial_worker:{wall_time:15.055084ms, concurrency:5, task_num:1, tot_wait:15.017625ms, tot_exec:12.333µs, tot_time:75.203959ms, max:15.042667ms, p95:15.042667ms}, final_worker:{wall_time:15.079958ms, concurrency:5, task_num:5, tot_wait:1.414µs, tot_exec:41ns, tot_time:75.277708ms, max:15.060375ms, p95:15.060375ms}                                                                                                                                                                                                                                                 | funcs:count(Column#19)->Column#17                  | 6.23 KB   | 0 Bytes |
| └─TableReader_24             | 1.00        | 1        | root         |                | time:16.9ms, open:1.9ms, close:3.46µs, loops:2, cop_task: {num: 2, max: 0s, min: 0s, avg: 0s, p95: 0s, copr_cache_hit_ratio: 0.00}                                                                                                                                                                                                                                                                                                                                                                                                                                                                                                      | MppVersion: 3, data:ExchangeSender_23              | 673 Bytes | N/A     |
|   └─ExchangeSender_23        | 1.00        | 1        | mpp[tiflash] |                | tiflash_task:{time:13.1ms, loops:1, threads:1}, tiflash_network: {inner_zone_send_bytes: 24}                                                                                                                                                                                                                                                                                                                                                                                                                                                                                                                                            | ExchangeType: PassThrough                          | N/A       | N/A     |
|     └─HashAgg_9              | 1.00        | 1        | mpp[tiflash] |                | tiflash_task:{time:13.1ms, loops:1, threads:1}                                                                                                                                                                                                                                                                                                                                                                                                                                                                                                                                                                                          | funcs:count(test.lineitem.L_RETURNFLAG)->Column#19 | N/A       | N/A     |
|       └─TableFullScan_21     | 11997996.00 | 11997996 | mpp[tiflash] | table:lineitem | tiflash_task:{time:12.8ms, loops:193, threads:12}, tiflash_scan:{mvcc_input_rows:0, mvcc_input_bytes:0, mvcc_output_rows:0, local_regions:10, remote_regions:0, tot_learner_read:0ms, region_balance:{instance_num: 1, max/min: 10/10=1.000000}, delta_rows:0, delta_bytes:0, segments:20, stale_read_regions:0, tot_build_snapshot:0ms, tot_build_bitmap:0ms, tot_build_inputstream:15ms, min_local_stream:10ms, max_local_stream:11ms, dtfile:{data_scanned_rows:11997996, data_skipped_rows:0, mvcc_scanned_rows:0, mvcc_skipped_rows:0, lm_filter_scanned_rows:0, lm_filter_skipped_rows:0, tot_rs_index_check:3ms, tot_read:53ms}} | keep order:false                                   | N/A       | N/A     |
+------------------------------+-------------+----------+--------------+----------------+-----------------------------------------------------------------------------------------------------------------------------------------------------------------------------------------------------------------------------------------------------------------------------------------------------------------------------------------------------------------------------------------------------------------------------------------------------------------------------------------------------------------------------------------------------------------------------------------------------------------------------------------+----------------------------------------------------+-----------+---------+
Execution Concurrency of Cop Task
First, let’s examine the execution plan. IndexLookUp_10 is a root operator . We know that the IndexLookUp operator mainly performs two steps: one is to obtain the row id of the target row through the index; the other is to read the required column data according to the rowid. In IndexLookUp_10 ‘s execution info , the details of index_task and table_task are listed separately. Obviously, index_task corresponds to the IndexRangeScan_8 operator, and table_task corresponds to the TableRowIDScan_9 operator.
From the perspective of concurrency, index_task does not display concurrency information, which means that the concurrency of the IndexRangeScan_8 operator defaults to 1 . However, the cop_task of the IndexRangeScan_8 is 15 (determined by the tidb_distsql_scan_concurrency parameter), which means that theoretically it can execute 15 cop tasks concurrently to read data.
For table_task, its concurrency is 5 (determined by the tidb_executor_concurrency parameter), which means that up to 5 TableRowIDScan_9 operators can run simultaneously. The distsql_concurrency of TableRowIDScan_9 cop_task is also 15 (determined by tidb_distsql_scan_concurrency ). Therefore, the maximum concurrent read capacity of table_task is 5 × 15 = 75 cop tasks.
Max => Min, 100ms => 8s
A SQL query calculating the max value of an indexed column took approximately 100 milliseconds. However, when modified to calculate the min value, execution time soared to 8+ seconds. Below is the `EXPLAIN ANALYZE` output for both scenarios:
 mysql> explain analyze select max(time_a) from t0 limit 1;
+--------------------------------+---------+---------+-----------+----------------------------------------------------+-------------------------------------------------------------------------------------------------------------------------------------------+----------------------------------------------------------+-----------+------+
| id                             | estRows | actRows | task      | access object                                      | execution info                                                                                                                            | operator info                                            | memory    | disk |
+--------------------------------+---------+---------+-----------+----------------------------------------------------+-------------------------------------------------------------------------------------------------------------------------------------------+----------------------------------------------------------+-----------+------+
| Limit_14                       | 1.00.   | 1       | root      |                                                    | time:2.328901ms, loops:2                                                                                                                  | offset:0, count:1                                        | N/A       | N/A  |
| └─StreamAgg_19                 | 1.00    | 1       | root      |                                                    | time:2.328897ms, loops:1                                                                                                                  | funcs:max(t0.time_a)->Column#18                          | 128 Bytes | N/A  |
|   └─Limit_39                   | 1.00    | 1       | root      |                                                    | time:2.324137ms, loops:2                                                                                                                  | offset:0, count:1                                        | N/A       | N/A  |
|     └─IndexReader_45           | 1.00    | 1       | root      |                                                    | time:2.322215ms, loops:1, cop_task: {num: 1, max:2.231389ms, proc_keys: 32, rpc_num: 1, rpc_time: 2.221023ms, copr_cache_hit_ratio: 0.00} | index:Limit_26                                           | 461 Bytes | N/A  |
|       └─Limit_44               | 1.00    | 1       | cop[tikv] |                                                    | time:0ns, loops:0, tikv_task:{time:2ms, loops:1}                                                                                          | offset:0, count:1                                        | N/A       | N/A  |
|         └─IndexFullScan_31     | 1.00    | 32      | cop[tikv] | table:t0, index:time_a(time_a)                     | time:0ns, loops:0, tikv_task:{time:2ms, loops:1}                                                                                          | keep order:true, desc                                    | N/A       | N/A  |
+------------------------------+---------+---------+-----------+----------------------------------------------------+-------------------------------------------------------------------------------------------------------------------------------------------+----------------------------------------------------------+-----------+------+
6 rows in set (0.12 sec)

mysql> explain analyze select min(time_a) from t0 limit 1;
+--------------------------------+---------+---------+-----------+----------------------------------------------------+------------------------------------------------------------------------------------------------------------------------------------------------------------------------------------------------------------------------------------------------------------------------------------+----------------------------------------------------------+-----------------+------+
| id                             | estRows | actRows | task      | access object                                      | execution info                                                                                                                                                                                                                                                                     | operator info                                            | memory          | disk |
+--------------------------------+---------+---------+-----------+----------------------------------------------------+------------------------------------------------------------------------------------------------------------------------------------------------------------------------------------------------------------------------------------------------------------------------------------+----------------------------------------------------------+-----------------+------+
| Limit_14                       | 1.00    | 1       | root      |                                                    | time:8.263857153s, loops:2                                                                                                                                                                                                                                                         | offset:0, count:1                                        | N/A             | N/A  |
| └─StreamAgg_19                 | 1.00    | 1       | root      |                                                    | time:8.26385598s, loops:1                                                                                                                                                                                                                                                          | funcs:min(t0.time_a)->Column#18                          | 128 Bytes       | N/A  |
|   └─Limit_39                   | 1.00    | 1       | root      |                                                    | time:8.263848289s, loops:2                                                                                                                                                                                                                                                         | offset:0, count:1                                        | N/A             | N/A  |
|     └─IndexReader_45           | 1.00    | 1       | root      |                                                    | time:8.26384652s, loops:1, cop_task: {num: 175, max: 1.955114915s, min: 737.989μs, avg: 603.631575ms, p95: 1.161411687s, max_proc_keys: 480000, p95_proc_keys: 480000, tot_proc: 1m44.809s, tot_wait: 361ms, rpc_num: 175, rpc_time: 1m45.632904647s, copr_cache_hit_ratio: 0.00}  | index:Limit_44                                           | 6.6025390625 KB | N/A  |
|       └─Limit_44               | 1.00    | 1       | cop[tikv] |                                                    | time:0ns, loops:0, tikv_task:{proc max:1.955s, min:0s, p80:784ms, p95:1.118s, iters:175, tasks:175}                                                                                                                                                                                | offset:0, count:1                                        | N/A             | N/A  |
|         └─IndexFullScan_31     | 1.00    | 32      | cop[tikv] | table:t0, index:time_a(time_a)                     | time:0ns, loops:0, tikv_task:{proc max:1.955s, min:0s, p80:784ms, p95:1.118s, iters:175, tasks:175}                                                                                                                                                                                | keep order:true                                          | N/A             | N/A  |
+--------------------------------+---------+---------+-----------+----------------------------------------------------+------------------------------------------------------------------------------------------------------------------------------------------------------------------------------------------------------------------------------------------------------------------------------------+----------------------------------------------------------+-----------------+------+
6 rows in set (8.38 sec)
Analysis
When using operator execution information for performance diagnosis, we generally first look at the execution time of each operator itself (excluding the time spent waiting for operator data) from top to bottom, and then look for the operator that has the greatest impact on the overall query performance. The following is the calculation method for operator execution time.
Operator Execution Time of Monad Operator
The following are the execution time calculation methods for different types of operators:
1. Operator of type “root”
You can directly subtract the execution time of an operator’s sub-operators from its total execution time to obtain the operator’s own processing time.
2. Operators of type “cop [tikv]”
Execution information contains tikv_task statistics. Execution time with wait operator data can be estimated using the following formula: Estimated execution time = avg × tasks/concurrency. Then, subtract the execution time of the sub-operator from this time to obtain the actual processing time of the operator.
3. Operators of type “mpp [tiflash]”, “cop [tiflash]” or “batchcop [tiflash]”
The execution information contains tiflash_task statistics. Usually, proc max can be subtracted from the proc max of the sub-operator to get the processing time of the operator. This is because all TiFlash tasks for the same query typically start executing at the same time.
Note : For the ExchangeSender operator, its execution time includes the time it takes for data to be received by the upper ExchangeReceiver operator, so it is often longer than the time it takes for the upper ExchangeReceiver to read memory data.
Operator Execution Time of Multi-Operator
For composite operators with multiple sub-operators, the execution info usually lists the execution information of each sub-operator in detail. For example, in the execution information of the IndexLookUp operator, the execution details of index_task and table_task are explicitly included. By analyzing the execution information of these sub-operators, we can accurately determine which sub-operator has a greater impact on the overall performance, so as to optimize in a more targeted way.
In this example, we can see that IndexReader_45 is the key operator with the greatest impact on performance. Comparing its execution information, it can be found that there is a significant difference in the number of cop tasks: in the “max” scenario, there is only one cop task; while in the “min” scenario, there are 175 cop tasks. At the same time, the number of proc_keys has also increased from 32 to 480,000.
Judging from the tags in the “operator info” column, the reading order in the “max” scenario is in descending order ( keep order, desc ), that is, reading from large to small; while in the “min” scenario, it is the default ascending order ( keep order ). The optimizer has optimized the reading order of the index according to the type of aggregation function – using descending reading in the “max” scenario and ascending reading in the “min” scenario. The original intention of this optimization strategy is to find the first data that meets the condition as soon as possible.
In the “min” scenario, there are a large number of deleted but uncollected keys near the smallest keys. Therefore, the system has to scan a large amount of useless data during the reading process until it finds the first valid data, which leads to significant performance overhead.
TiDB Observability: Future Outlook
In TiDB 9.0 Beta 1, we will further enhance operator execution information and improve system observability. Key improvements include:
- More Accurate Performance Attribution: This improvement will enhance the accuracy of operator timing by including both initialization (open) and finalization (close) times. Previously, execution metrics could underreport actual runtimes, making it harder to pinpoint performance bottlenecks. Now, the reported time reflects the full wall-clock duration (time) from start to finish, helping DBAs get a truer picture of spent time during query execution.
Why it matters:
You can now identify slow operators and distinguish between slow execution vs. slow setup/teardown more reliably, reducing false assumptions during tuning. - Clearer Time Accounting for Concurrent Execution: Previously, when the operator had multiple concurrent executions, the cumulative wall time could be misleading. In some cases, sub-operators could appear slower than their parent, leading to confusion. This improvement introduces total_time, total_open, and total_close, which separately report accumulated time across concurrent tasks, offering a clearer breakdown of time spent.
Why it matters:
You can now distinguish real bottlenecks from artifacts of concurrent execution, making root cause analysis when investigating performance issues. - Better Diagnosis of TiFlash Specific Delays: TiFlash execution info now includes new latency metrics like minTSO_wait, pipeline_breaker_wait, and pipeline_queue_wait. These metrics reveal hidden wait times during MPP task scheduling and pipeline execution.
Why it matters:
You can now distinguish real bottlenecks from artifacts of concurrent execution, making root cause analysis when investigating performance issues.
With these improvements, TiDB will provide users with more comprehensive and accurate execution information, helping to better diagnose and optimize query performance.
If you have any questions about TiDB observability, please feel free to connect with us on Twitter, LinkedIn, or through our Slack Channel.
Experience modern data infrastructure firsthand.


TiDB Cloud Dedicated
A fully-managed cloud DBaaS for predictable workloads
TiDB Cloud Starter
A fully-managed cloud DBaaS for auto-scaling workloads