

In TiDB’s runtime environment, issues related to memory management, garbage collection (GC) behavior, and lock contention at the Go Runtime level can significantly impact system stability and performance. However, such problems are often difficult to reproduce and analyze directly. As a result, high-quality runtime monitoring metrics are essential for effective troubleshooting and performance tuning.
This blog introduces the TiDB Runtime Dashboard, focusing on its practical value in diagnosing runtime issues. We will first outline the types of problems this dashboard is designed to help investigate. Then, we will provide detailed explanations of commonly used panels. Finally, we will walk through a real-world example to demonstrate how these panels can assist in analyzing and pinpointing issues.
Note: This article is based on the TiDB Runtime Dashboard available in TiDB 8.5.
TiDB Runtime Dashboard: Applicable Troubleshooting Scenarios
This section outlines common symptoms such as memory spikes, CPU overhead, GC-induced latency, and lock contentions. It explains how to use specific monitoring panels to identify their root causes. Each scenario includes guidance on what to look for and how to interpret TiDB’s runtime metrics for faster, more targeted troubleshooting.
Abnormal Memory Usage
When a TiDB instance experiences an OOM (Out of Memory) event or abnormally high memory usage, the Memory Usage panel can help identify the root cause. By analyzing memory usage trends and object allocation breakdowns, users can determine whether the issue is due to a memory leak, frequent small-object allocations, or delayed garbage collection.
Abnormal CPU Usage
For issues involving unexpectedly high or fluctuating CPU usage, the Estimated Portion of CPU Time panel provides insights into how CPU time is distributed between user code and Go Runtime components. This helps identify whether GC, scavenging, or other runtime-level processes are consuming excessive CPU resources, aiding in pinpointing the true source of overhead.
Latency Spikes Caused by GC
Inefficient garbage collection behavior can cause significant latency jitter, especially when frequent stop-the-world (STW) pauses occur in a short time. Panels such as Golang GC, GC STW Latency, and GOGC & GOMEMLIMIT provide a comprehensive view of GC frequency, duration, and configuration parameters, helping assess whether GC behavior is reasonable.
Lock Contention
When a TiDB instance exhibits high CPU usage or blocked Goroutines, it may be due to lock contention or scheduler resource pressure. Panels like Goroutine Count and SyncMutex Wait reveal whether large numbers of Goroutines block or if the system uses locks inefficiently, providing valuable clues for further investigation.
TiDB Runtime Dashboard: Explaining Key Panels in Detail
In this section, we’ll break down the most important monitoring panels—what they measure, why they matter, and how to interpret their output. Whether you’re tracking memory consumption, garbage collection frequency, or lock contention, these visualizations provide a window into the inner workings of the TiDB runtime and Go execution environment.
Memory Usage
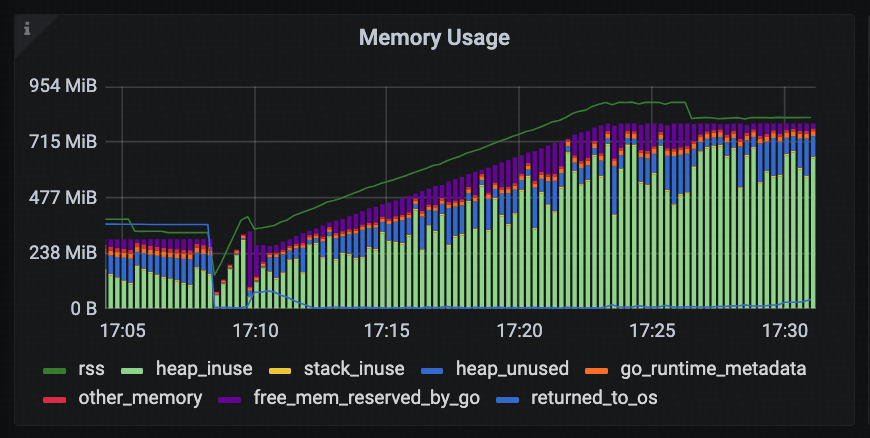
This panel displays the overall memory usage of the tidb-server process. It consists of:
- RSS line graph: Shows the actual physical memory usage (Resident Set Size) of the process.
- Stacked bar chart: Breaks down memory usage into detailed categories to help users understand memory consumption.
Descriptions of the main fields in the stacked bar chart:
- heap_inuse: Heap memory actively used by Go application code.
- heap_unused: The Go Runtime allocates this heap memory from the operating system but does not currently use it (it remains reserved but unallocated).
- stack_inuse: Memory used by Goroutine stacks.
- go_runtime_metadata: Overhead from Go Runtime for managing metadata such as type and memory information.
- free_mem_reserved_by_go: Free memory reserved by the Go Runtime from the OS, held for future allocations to reduce the overhead of frequent system calls.
This panel allows users to quickly assess whether memory usage is healthy and whether there are signs of over-allocation or delayed memory release.
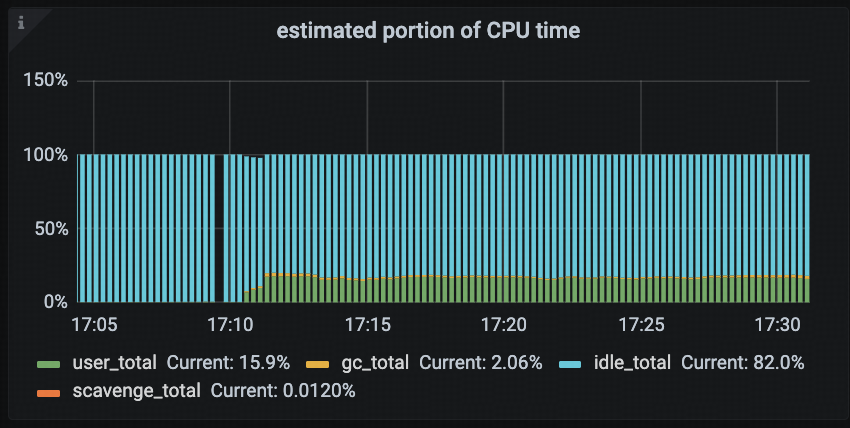
Estimated Portion of CPU Time
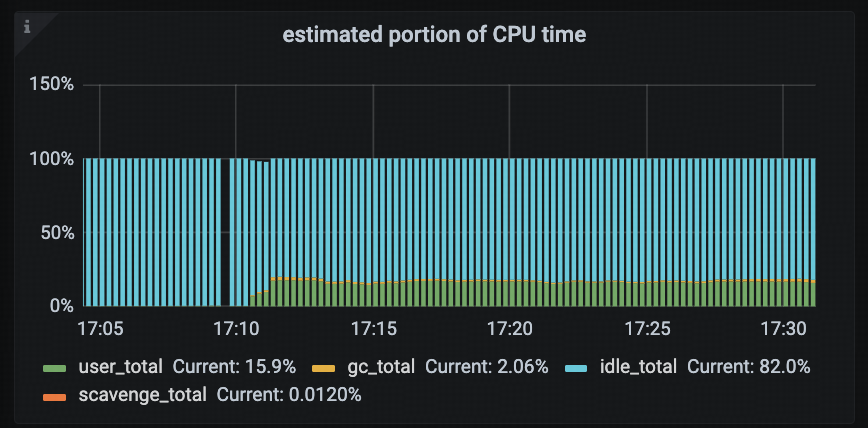
This panel displays the estimated CPU time distribution across different types of system tasks in a TiDB instance. It helps users quickly identify the primary sources of CPU consumption. This panel helps diagnose high CPU usage scenarios by showing whether business logic or the Go Runtime (e.g., garbage collection or memory scavenging) consumes the CPU.
The main fields in this panel include:
- user_total: CPU time consumed by user code, typically representing the cost of actual business logic execution.
- gc_total: CPU time used by Golang garbage collection (GC), reflecting the impact of memory reclamation on CPU resources.
- idle_total: Time when the CPU is idle (i.e., no runnable tasks in the scheduler), useful for identifying over-provisioned resources or low workload.
- scavenge_total: CPU time spent by the Go Runtime scavenger, which runs in the background to return unused physical memory pages to the operating system.
This panel can help answer several common questions:
- Is the TiDB instance currently under GC pressure?
- Is a significant portion of CPU being consumed by background runtime tasks such as scavenging?
- Does user-level CPU usage align with the expected business load?
Users can also combine this panel with Golang GC, GC STW Latency, and other related panels to build a comprehensive view of GC-related performance overhead.
Golang GC
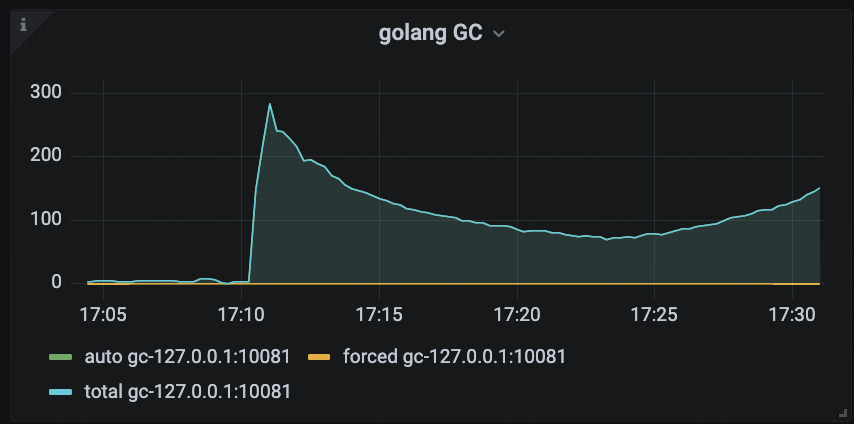
This panel shows the number of Golang garbage collection (GC) events triggered during each monitoring interval, helping users visualize the frequency of GC operations.
Users often analyze the impact of GC on CPU resource consumption by using this panel in conjunction with the Estimated Portion of CPU Time panel. For example, if the GC trigger frequency is high and the corresponding CPU time used by GC increases significantly, it may indicate GC pressure within the system, which could negatively affect overall TiDB performance.
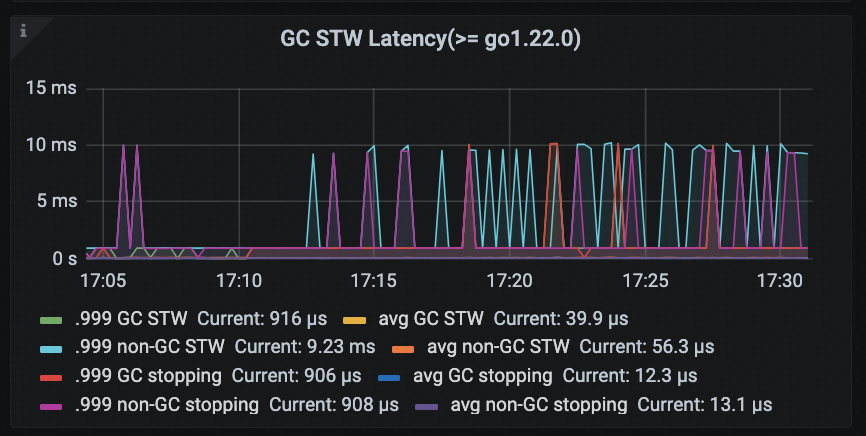
GC STW Latency (>= go 1.22.0)
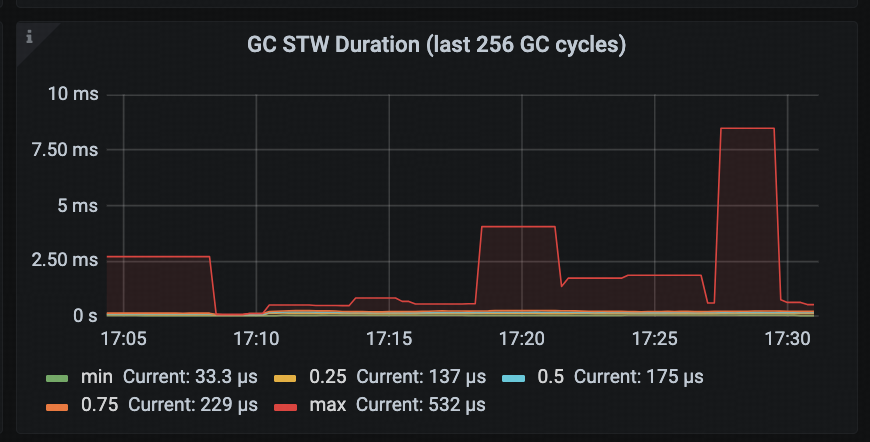
This panel displays the latency of Stop-The-World pauses triggered by garbage collection, offering a more fine-grained and low-latency view compared to the older GC STW Duration (last 256 GC cycles) panel (shown in the first diagram below).
In addition, this panel distinguishes between GC-triggered STW and non-GC-triggered STW events, allowing users to analyze the performance impact of STW pauses in greater detail. For example, if non-GC-related STW latency is high, it may point to overhead from other sources such as frequent profile collection or debugging operations.
Note: The GC STW Duration (last 256 GC cycles) panel presents quantile statistics (e.g., min / p25 / p50 / p75 / max) for STW durations across the most recent 256 GC cycles. Compared to GC STW Latency, its granularity is relatively coarse and is better suited for historical trend analysis.
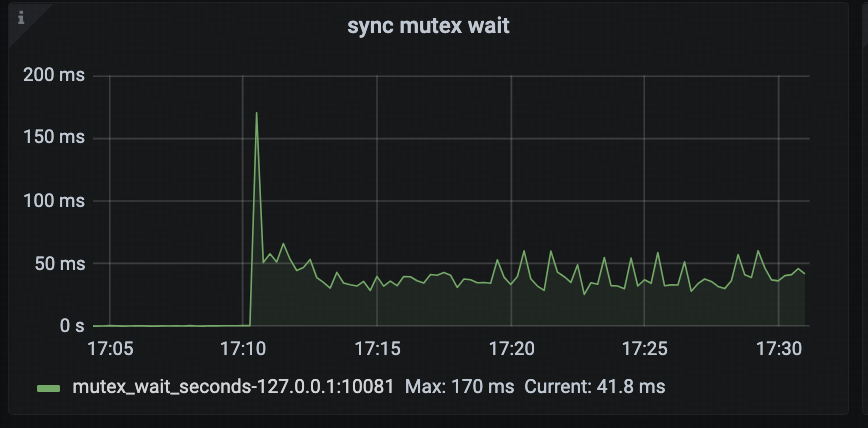
Sync Mutex Wait
This panel displays the cumulative time (approximate) that Goroutines spend blocked on sync.Mutex or sync.RWMutex, helping users analyze lock contention within the system.
By observing this panel, users can easily assess whether there are serious synchronization bottlenecks. For example, if TiDB’s concurrency performance degrades and this metric shows a significant increase, it may indicate that critical execution paths are experiencing severe lock contention. In such cases, users should inspect mutex profiles or Goroutine stack traces to locate the root cause.
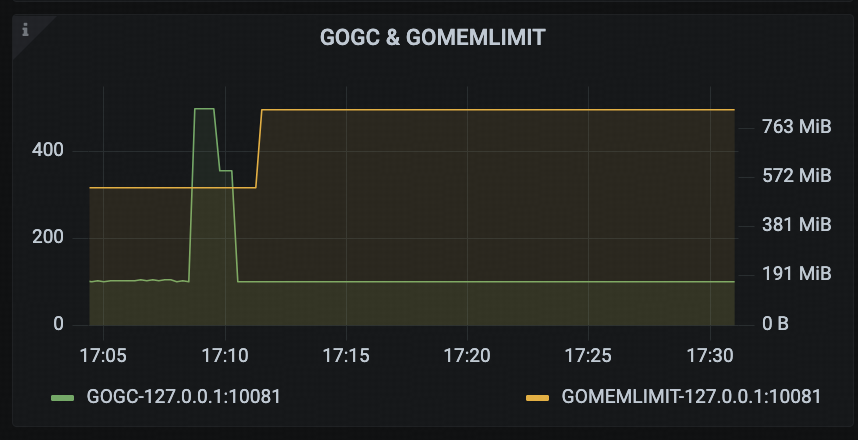
GOGC & GOMEMLIMIT
This panel displays two key configuration parameters related to Golang’s GC: GOGC and GOMEMLIMIT. These settings directly influence the memory management behavior of the Go Runtime.
By monitoring this panel, users can determine whether TiDB’s memory control mechanisms—such as enable_gogc_tuner and tidb_server_memory_limit—are functioning as expected.
TiDB Runtime Dashboard Example: Golang GC Causing Sustained 100% CPU Usage in tidb-server
This GitHub issue reproduces a real-world problem encountered in a customer environment: after upgrading TiDB from an older version to TiDB 6.5, the tidb-server began experiencing sustained high CPU usage once memory consumption approached the threshold defined by tidb_server_memory_limit. This issue did not occur in earlier versions prior to the upgrade.
TiDB Runtime Dashboard Observations
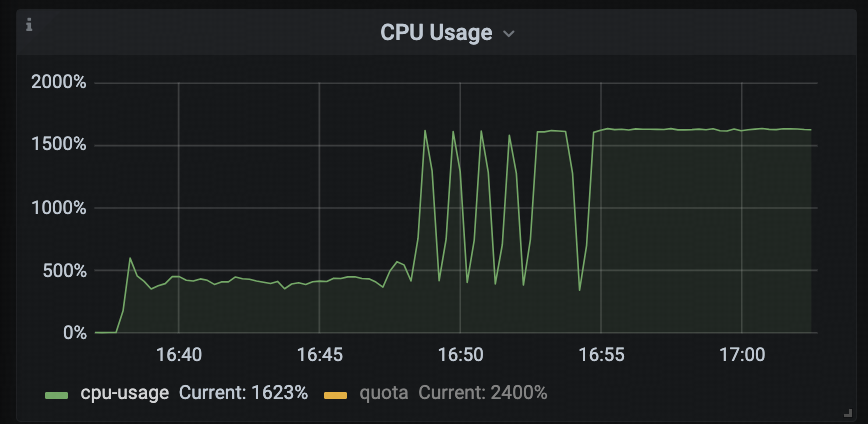
From the TiDB Runtime → CPU Usage monitoring panel, we can see that CPU utilization started fluctuating significantly around 16:48, and after 16:55, it remained consistently at 1600%, severely impacting business throughput.
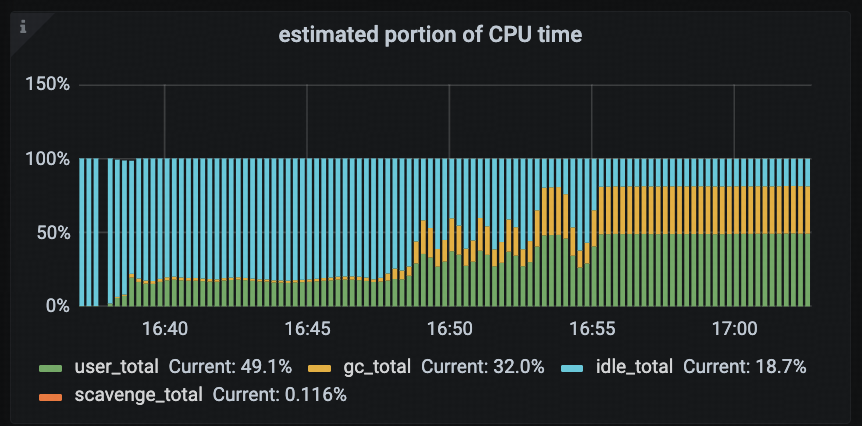
Given the abnormal CPU usage, the first step was to examine the TiDB Runtime → Estimated Portion of CPU Time panel to analyze which tasks were contributing to the high CPU load.
According to the monitoring data, the gc_total (CPU time spent on garbage collection) percentage increased significantly after 16:48, jumping from 1.8% to eventually stabilizing at around 32%. Additionally, there was a clear positive correlation between the rise in gc_total and the overall CPU saturation, indicating that GC activity was a major contributor to the high CPU load.
Mechanism Analysis
TiDB 6.5 introduced two new configuration parameters:
tidb_server_memory_limittidb_server_memory_limit_gc_trigger
When the memory usage of the tidb-server process reaches tidb_server_memory_limit * tidb_server_memory_limit_gc_trigger, TiDB will proactively trigger a Golang GC. This mechanism is implemented by dynamically adjusting the Go runtime’s GOMEMLIMIT variable. The new GOMEMLIMIT value is set to tidb_server_memory_limit * tidb_server_memory_limit_gc_trigger.
To avoid excessively frequent GC events, TiDB adopts an adaptive adjustment strategy:
- Initial state: When memory usage is below the threshold,
tidb_server_memory_limit_gc_triggerremains at its default value of0.7. - After GC is triggered: Once memory exceeds the threshold and triggers a GC,
tidb_server_memory_limit_gc_triggeris increased to1.1, and then it automatically falls back to0.7after one minute.
The expected behavior across different memory ranges is as follows:
- Memory usage <
tidb_server_memory_limit * 0.7: The trigger remains at0.7, and CPU usage should stay within normal operational bounds. - Memory usage between
[limit * 0.7, limit * 1.1): Each time the trigger drops back to0.7, it is immediately bumped back up to1.1. CPU load should still reflect regular workload patterns. - Memory usage ≥
limit * 1.1: The trigger remains at1.1long-term. However, due to frequent GC, CPU utilization may spike and reach saturation.
Note: Because of the contribution of non-heap memory, the actual upper and lower bounds may be slightly higher than the theoretical values.
Case-Specific Analysis
In this particular case:
tidb_server_memory_limit = 760MBtidb_server_memory_limit_gc_trigger = 0.7- The calculated threshold range is:
- Lower bound: 760MB * 0.7 = 532MB
- Upper bound: 760MB * 1.1 = 836MB
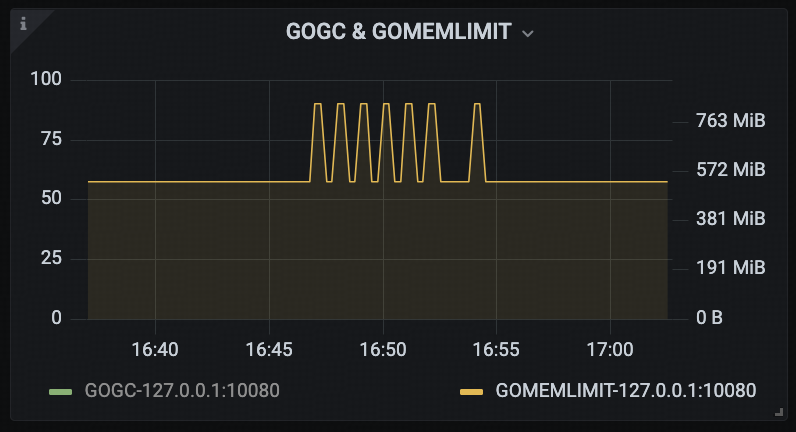
According to the TiDB Runtime → GOGC & GOMEMLIMIT panel, during the period from 16:46 to 16:55, GOMEMLIMIT fluctuated between the calculated bounds. After 16:55, the system consistently met the trigger condition for frequent GC, keeping it locked at the lower bound.
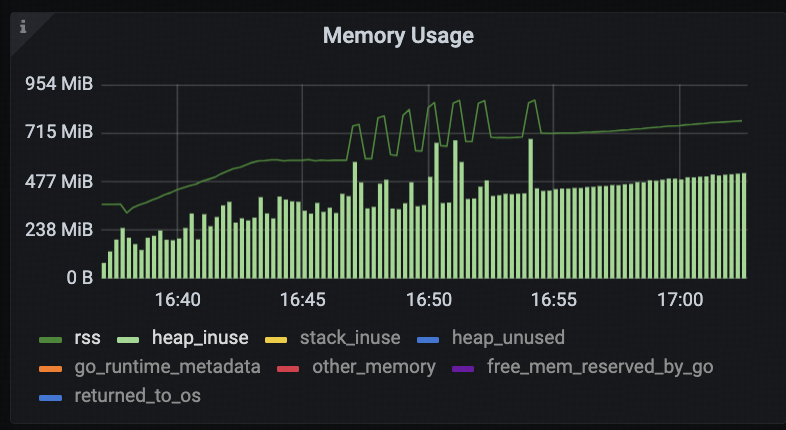
Meanwhile, based on the TiDB Runtime → Memory Usage panel, the tidb-server process’s RSS memory usage increased from 580MB to 712MB between 16:46 and 16:55, and continued to rise afterward.
According to the previously described mechanism, within this memory range, GOMEMLIMIT should have remained near the upper bound. However, monitoring data showed that GOMEMLIMIT was still fixed at the lower bound, which deviates from the expected behavior.
This discrepancy suggests that the adaptive adjustment mechanism for tidb_server_memory_limit_gc_trigger may not have taken effect as intended.
During subsequent code analysis, it was confirmed that there was a bug in the implementation of the automatic adjustment mechanism for tidb_server_memory_limit_gc_trigger. This bug prevented GOMEMLIMIT from being correctly updated, which in turn led to frequent GC cycles and ultimately caused sustained high CPU usage.
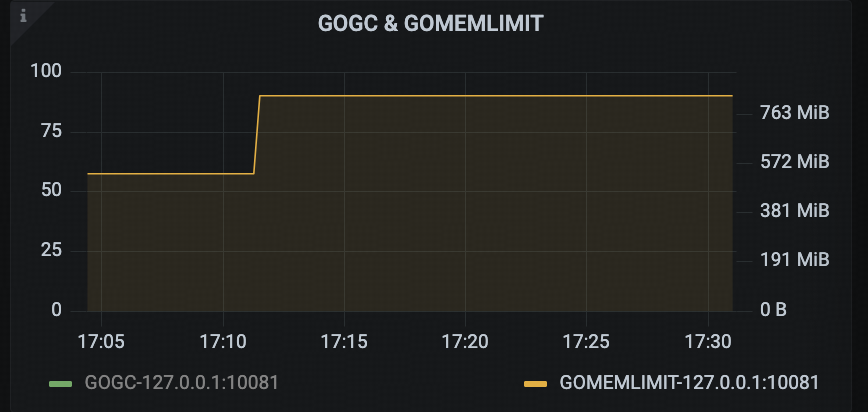
After applying the fix and re-running the tests, monitoring data showed that GOMEMLIMITwas now adapting as expected, the CPU time percentage of Golang GC stabilized around 2%, and the overall CPU usage of the TiDB instance no longer reached saturation.

Conclusion
The TiDB Runtime Dashboard provides comprehensive visibility into the Go Runtime layer, covering key aspects such as memory usage, garbage collection behavior, scheduler latency, and lock contention. With a solid understanding and effective use of these core panels, users can more efficiently identify potential performance issues within TiDB instances—especially when dealing with hard-to-reproduce problems, where runtime metrics often offer crucial diagnostic clues.
In real-world operations and troubleshooting scenarios, we recommend combining business context, monitoring trends, and profiling tools to perform more targeted and efficient analysis.
Launch TiDB Cloud now to explore TiDB’s full suite of observability features in a live environment.
Experience modern data infrastructure firsthand.


TiDB Cloud Dedicated
A fully-managed cloud DBaaS for predictable workloads
TiDB Cloud Starter
A fully-managed cloud DBaaS for auto-scaling workloads