
In today’s data-driven world, businesses must manage and process vast amounts of data from diverse sources. Integrating various systems has become critical and painful.
In this blog, we’ll introduce a new integration of TiDB Cloud and Zapier that lets businesses connect multiple data-intensive applications with streamlined workflows and receive informed business insights in real time.
TiDB Cloud and Zapier integration solves business problems
Zapier is a powerful no-code platform that lets you connect data sources and automate workflows without any coding experience. TiDB Cloud is the fully-managed service of TiDB, an advanced, open-source, distributed SQL database that provides real-time data access with low latency and horizontal scalability. TiDB Cloud also has Hybrid Transactional and Analytical Processing (HTAP) capabilities, making it ideal for businesses with hybrid workloads.
With these two powerful tools integrated, companies in different industries can automate repetitive and also gain real-time insights into business operations. The results? Better performance and higher efficiency.
This integration can solve a lot of real world business problems. For example, in the retail industry, this integration helps optimize retail business operations, allowing retailers to focus on business growth. In the healthcare industry, clinics and hospitals can improve their patient management and billing processes, resulting in more revenue and improved patient satisfaction.
TiDB Cloud and Zapier integration in action
We’ll now examine how to use Zapier to connect Google Sheets with TiDB Cloud. We will also share how Chat2Query, the AI powered SQL generator in TiDB Cloud, can help you automatically generate SQL scripts to aggregate data from TiDB Cloud. Finally, we’ll explore how you can leverage analytics and business intelligence tools like Grafana to visualize and gain insights from your aggregated data. Let’s dive in!
Prerequisites
Before you begin, make sure you have the following accounts.
- Zapier
- TiDB Cloud. After you create the account, create a free Serverless Tier cluster. For details, see TiDB Cloud Quick Start.
- Grafana
Set up TiDB Cloud
Create API Keys
To create API Keys, do the following:
- On the TiDB Cloud page, click the Organization icon.
- On the scroll-down menu, select the Organization Settings option.

- Click Create API Key and enter a description, for example New Zapier Key.
- Click Done.
TiDB Cloud automatically creates the public and private keys. Copy and save them for later use.
Create a table
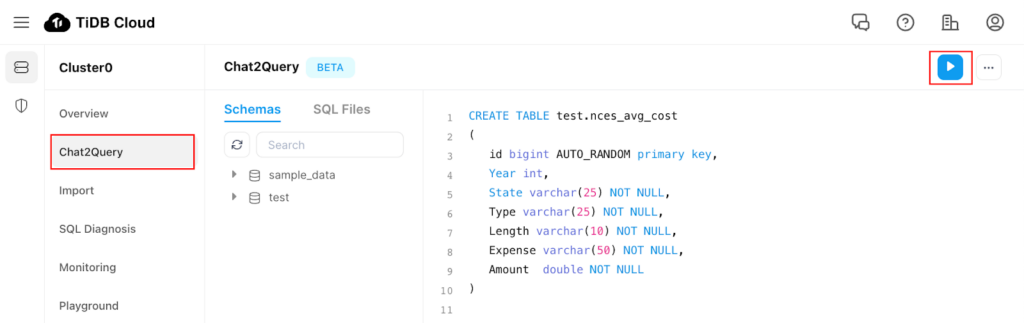
Use the Chat2Query editor to execute a SQL script to create a `nces_avg_cost` table. The sample dataset will be stored in this table later.
CREATE TABLE test.nces_avg_cost

(

   id bigint AUTO_RANDOM primary key,

   Year int,

   State varchar(25) NOT NULL,

   Type varchar(25) NOT NULL,

   Length varchar(10) NOT NULL,

   Expense varchar(50) NOT NULL,

   Amount  double NOT NULL

)
For this example, we’ll use the National Center for Education Statistics (NCES) data as a sample dataset. This dataset contains college tuition fee data for different states in the US.
Set up Google Sheets
Next, sign into your Google Docs account and create a new spreadsheet with the columns as shown below. Alternatively, you can copy this Google spreadsheet. You can also add a row of data to the spreadsheet. This will help us when we test our Zap trigger later.
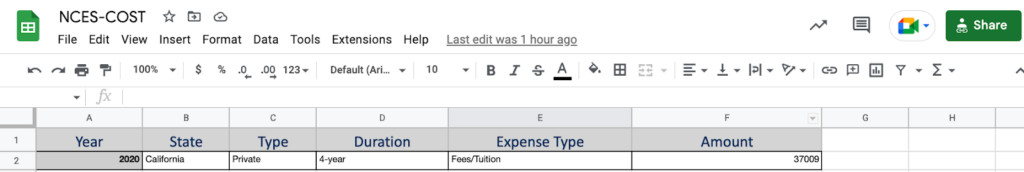
Note: The sheet contains only columns. The column names match the table columns that we created earlier.
Create a Zap: connecting Google Sheets with TiDB Cloud
You’ve created a Google Sheet and a TiDB Cloud instance. Now, we’ll use Zapier to connect them. Zapier lets you automate workflows by creating “Zaps” that consist of triggers and actions. In this case, we’ll create a Zap that triggers an action in TiDB Cloud whenever a new row is added to our Google Sheet. This will ensure that the TiDB Cloud database has the latest data from the Google Sheet, without requiring any manual effort.
Create a new Zap
To create a new Zap:
- Log in to your Zapier account and navigate to the dashboard. (As an alternative, you can access this Integration by logging into your TiDB Cloud account and navigating to the Integrations page.)
- On the Make a Zap page, select Google Sheets to connect with TiDB Cloud.

- Create the trigger and action. Select New Spreadsheet Row to Create Row. This tells Zapier to create a new row in the TiDB Cloud database whenever a new row is added to your Google Sheets.
- Click Try it.
Configure the trigger
- Click the Edit icon and name the Zap NCES Data Integration.

- Configure the trigger. Leave Choose app & event with their default values.
- Choose an account. Click Connect a new account. Specify the Google account that has your Google Sheets.
- Set up a trigger. Choose the Spreadsheet and Worksheet that has column headers.
- Test the trigger. Select the row from the drop-down list and click Continue.
Configure the action
After you configure the Zap, you can configure the action.
- Leave Choose app & event with their default values.
- Choose an account. Click Connect a new account.
- Enter the Public Key and Private Key information that you obtained from TiDB Cloud earlier and then click Yes, Continue.

- In the Set up action section, enter TiDB Cloud Connection information.
- Map the Google Sheet columns with the columns from the`nces_avg_cost` table.
Note: Leave the Id column blank. It’s configured to be an auto-generated column in the table.

- Once the mapping is done, click Continue.
- Test it to ensure that it’s working properly. This will create a single row in TiDB Cloud.
- If everything looks good, click Publish Zap.

With your Zap published and running, you can test it by adding new records to your Google Sheets. You can find free sample datasets on Kaggle or use our sample data sheet.
To explore and review the data generated by our TiDB Cloud Zap, we’ll use datasets from 2020 and 2021 for five US states.
Note: Zapier’s free tier only runs Zaps every 15 minutes, so you may need to wait up to 15 minutes for the new rows to be added to TiDB Cloud. If you are on a Professional or Team Plan, the updates will be triggered instantly.
Exploring and reviewing data
Now that we have successfully integrated Google Sheets with TiDB Cloud, and data is automatically updated in the database, it’s time to explore and review that data. We’ll use TiDB’s AI-powered Chat2Query feature to generate a SQL query that aggregates and summarizes the data. We will be looking at the year-on-year tuition fees in each state for a 4-year program. Then we’ll use a popular visualization tool, Grafana, to create a dashboard to display that data so it’s easy to understand and analyze.
Data exploration with Chat2Query
To access Chat2Query:
- Navigate to the TiDB Cloud Clusters page and select the target cluster.
- Open the query editor. In the left navigation panel, click Chat2Query.
- Ask a question to generate a query. As an example, we can ask Chat2Query to generate a query that retrieves the tuition fees for each state for a four-year program.

After Chat2Query generates the query, you can modify it as needed to ensure that the output matches your visualization requirements.
SELECT  Year, CONCAT(State, ' - ', Year) AS State, SUM(Amount) AS Tuition

FROM test.nces_avg_cost

WHERE Length like '%4%'

GROUP BY  Year,State

ORDER BY State, Year DESC
Data visualization
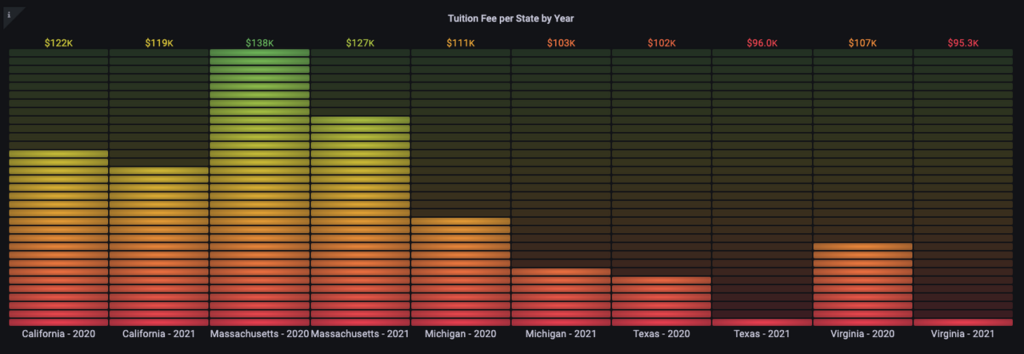
After you use Chat2Query to generate the SQL query and tweak it to fit your needs, you can use Grafana (or other MySQL-compatible visualization tool) to visualize the data. To connect Grafana to your TiDB cluster, follow the steps in How to connect Grafana to a remote MySQL database.
Grafana lets you create charts and dashboards that help you better understand your data. In our case, we’ll create a bar chart that shows the year-over-year tuition fees for four-year programs in the five states we selected. As you can see from the chart, most states had a significant decrease in tuition between 2020 and 2021. A few others remained relatively stable. With this visualization, we can quickly gain insights and make data-driven decisions that impact our educational choices.
Summary
Integrating TiDB Cloud and Zapier offers a powerful solution for businesses to manage their data and streamline their workflows. This integration also allows businesses to gain valuable insights from their data, make more informed decisions, and improve overall efficiency.
We hope you find this blog useful. If you’re interested in this integration, you are welcome to sign in to (or sign up for) your TiDB Cloud and Zapier accounts and give them a try. If you want more deployment details for this integration, see our documentation. If you have any questions, feel free to contact us through Twitter, LinkedIn, or our Slack Channel.
Spin up a database with 25 GiB free resources.


TiDB Cloud Dedicated
A fully-managed cloud DBaaS for predictable workloads
TiDB Cloud Starter
A fully-managed cloud DBaaS for auto-scaling workloads