
In today’s data-driven world, analyzing large datasets quickly and easily is essential. With powerful tools like TiDB Cloud and Streamlit, developers can build custom, interactive user interfaces that make it easier to analyze and visualize data.
TiDB Cloud is the fully-managed service of TiDB, an advanced, open-source, distributed SQL database that provides real-time access to transactional data with low latency and horizontal scalability. Combined with Streamlit, TiDB Cloud can provide real-time access to financial data and enable users to analyze and visualize the data in real-time.
Streamlit, on the other hand, is an open-source Python framework that simplifies the process of building web applications. It provides an intuitive API that enables developers to create powerful data applications with minimal effort.
In this post, we’ll show you how to use TiDB Cloud and Streamlit to build an interactive Stock Data web application. We’ll walk you through the code to explain some of the building blocks of the application. You’ll learn how to connect to TiDB Cloud, retrieve data from the Yahoo Finance API, and use Plotly to visualize the data. By the end of this tutorial, you’ll have a better understanding of how to leverage these powerful tools to build similar applications that can streamline your data analysis and visualization workflows.
Prerequisites
Before you begin, you will need to set up the following:
- A TiDB Cloud account and a free Serverless Tier cluster on TiDB Cloud. For details, see TiDB Cloud Quick Start.
- Python 3
- Git
Initial setup
Setting up the Stock Data Project
1. Clone the integration example code repository for TiDB Cloud and Streamlit. From your terminal or command prompt (Windows user), run the following command:
git clone https://github.com/tidbcloud/streamlit-stockdata-analysis.git 2. Navigate to the project’s root directory “streamlit-stockdata-analysis”. Enter:
cd streamlit-stockdata-analysis3. Install the project dependencies listed in requirements.txt. In the terminal window, enter:
python3 -m pip install -r requirements.txtStoring Database Secrets
We will now create a secrets file to store the connection information for the TiDB Cloud cluster. The Streamlit app will reference this file to establish a connection with the TiDB database. For more information on connecting a Streamlit app with TiDB, please refer to the Streamlit tutorial, Connect Streamlit to TiDB.
- In the project’s root directory, create a file named .streamlit/secrets.toml.
- Add the following content to the file, replacing the placeholder values with your TiDB Cloud Cluster information:
#.streamlit/secrets.toml
[tidb]
host = "<TiDB_cluster_host>"
port = 4000
database = "test"
user = "<TiDB_cluster_user>"
password = "<TiDB_cluster_password>"
ssl_ca = "<path_to_CA_store>"
The Certificate Authority (CA) store path depends on your operating system. You can find this path in the Connection tab of the TiDB Cloud cluster. For example, on macOS, the path would be /etc/ssl/cert.pem.
For more information on connecting a Streamlit app with TiDB, refer to the Streamlit documentation.
Creating a TiDB Table for Storing Stock Data
To store daily historical stock data for a ticker symbol in TiDB, follow these steps:
- Log in to the TiDB Console and navigate to the cluster overview page.

- On the left navigation pane, select the Chat2Query interface, and execute the SQL script shown below. The script creates a `stock_price_history` table inside the test database. This table stores information such as the volume of stock traded, dividends gained, and opening and closing prices.
SQL
CREATE TABLE test.stock_price_history
(
  id int PRIMARY KEY AUTO_INCREMENT,
  Opening_Price DOUBLE,
  High DOUBLE,
  Low DOUBLE,
  Closing_Price DOUBLE,
  Volume BIGINT,
  Dividends DOUBLE,
  Market_Date DATE,
  Ticker VARCHAR(10)
);
The stock data project in action
Now that you have completed the initial setup, it’s time to put the project into action. For this walkthrough, we will gather and analyze 10 years of stock historical data for Microsoft (MSFT) and Google (GOOGL). If you’d rather track other stocks, substitute the ticker symbols you’d like. The application retrieves data from the Yahoo Finance API, saves it in TiDB Cloud, and visualizes it using Plotly’s 3D charts.
- Run the project on your local machine. From the terminal or command prompt (Windows user), enter
streamlit run stocks.py. - Launch the application in your web browser at http://localhost:8502.
- In the default menu, select Collect Trade Data. Enter the ticker symbol for the stock you want to analyze, in this case, MSFT.
- Leave the start and end dates to their default values, and click Get Data to retrieve 10 years of historical data for the selected stock.

- Click Save Data to store the retrieved stock data in TiDB Cloud.

- Repeat steps 3-5 to get data for Google, with the ticker symbol GOOGL.
- To analyze the data, click Visualize Trade Data, enter the corresponding ticker symbols, keep the default date values, and click Visualize.

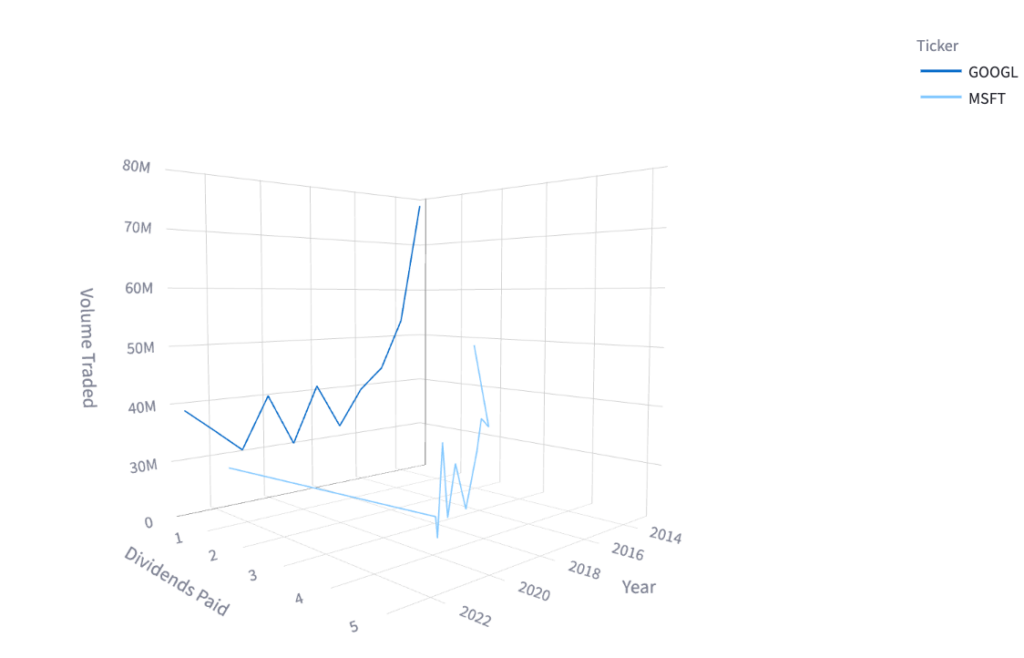
This action will execute an analytical query on TiDB and display the results in a 3D chart that compares the total dividend paid and volume traded over the years for Google and Microsoft stocks.
Code walkthrough
In this section, we’ll examine important elements of the Stock Data Project’s code. We’ll explore the application’s components and how they interact to collect, analyze, and visualize historical stock data. We’ll also discuss the various packages used and how they contribute to the application’s overall functionality.
Packages used
import streamlit as st
import yfinance as yf
import pandas as pd
import plotly.express as px
import pymysql| Package | Description |
streamlit | Builds web applications for data science and machine learning projects |
yfinance | Retrieve and analyze historical stock price data from Yahoo Finance |
pandas | Data manipulation and analysis |
plotly.express | Creates interactive visualizations |
pymysql | Interacts with TiDB |
Together, these packages and TiDB provide a powerful toolkit to build interactive web pages that analyze, visualize, and store data.
Accessing TiDB
The functions that interact with TiDB provide the foundation for the analysis and visualization capabilities of the project.
Connecting to the database
The init_connection() function connects to the TiDB database using credentials stored in Streamlit Secrets Manager. The function returns a connection object that is used to fetch and store data.
def init_connection():
    config = st.secrets["tidb"]
    return pymysql.connect(
        host=config["host"],
        port=config["port"],
        user=config["user"],
        password=config["password"],
        database=config["database"],
        ssl_verify_cert=True,
        ssl_verify_identity=True,
        ssl_ca= config["ssl_ca"]
    )

conn = init_connection()
Saving data
The get_ticker_data() function retrieves historical stock data for a given ticker symbol, start date, and end date. Using the yfinance library of Yahoo Finance, the function returns a pandas.DataFrame that contains the stock’s open, high, low, close, volume, and dividends:
def get_ticker_data(symbol, start_date, end_date):
    ticker = yf.Ticker(symbol)
    data = ticker.history(start=start_date, end=end_date)
    return data
The save_data() function inserts the stock data into the TiDB database using the bulk insert method executemany of the pymysql library. The function takes a pandas.DataFrame and a ticker symbol as input. The function then formats the data and inserts it into the database.
def save_data(data, symbol):
    data["Date"] = data.index
    data["Ticker"] = symbol
    data.reset_index(drop=True, inplace=True)

    df = data.loc[:, ['Open', 'High', 'Low', 'Close', 'Volume', 'Dividends', 'Date', 'Ticker']]

    cur = conn.cursor()

    data = [tuple(row) for row in df.itertuples(index=False)]

    query = 'INSERT INTO stock_price_history (Opening_Price, High, Low, Closing_Price,Volume, Dividends , Market_Date, Ticker) VALUES (  %s,  %s,  %s,  %s, %s,  %s, %s, %s);'
    cur.executemany(query, data)

    rows_upserted = cur.rowcount

    # commit the changes
    conn.commit()
    cur.close()
    conn.close()
    st.success( str(rows_upserted) +  " data saved successfully!")
Retrieve data
The fetch_data() function leverages TiDB’s Hybrid Transactional/Analytical Processing (HTAP) capabilities to execute SQL queries and retrieve aggregated stock data information.
The function accepts two stock ticker symbols and a date range and returns a pandas.DataFrame containing the ticker symbols, year, total dividends, and the average volume traded.
def fetch_data(symbol1, symbol2, start_date, end_date):
    cursor = conn.cursor()
    query = f"""
    SELECT Ticker, YEAR(Market_Date) AS Year, ROUND(SUM(Dividends), 2) AS Total_Dividends, CAST(ROUND(AVG(Volume), 2) AS DOUBLE) AS Avg_Volume
    FROM stock_price_history
    WHERE Ticker IN ('{symbol1}', '{symbol2}') AND Market_Date BETWEEN '{start_date}' AND '{end_date}'
    GROUP BY Ticker, YEAR(Market_Date)
    ORDER BY Ticker, YEAR(Market_Date) ASC;
    """
    cursor.execute(query)
    data = cursor.fetchall()
    cols = ['Ticker', 'Year', 'Total_Dividends', 'Avg_Volume']
    df = pd.DataFrame(data, columns=cols)
    return df
Web application
The web application lets you collect and visualize historical stock trade data.
Collecting trade data
The Collect Trade Data page lets users enter a stock ticker symbol, a start date, and an end date. When users click Get Data, the app retrieves historical trade data for the specified stock within the given date range and displays it in a table. The data is stored in the session state until the user saves it or navigates away from the page.
# Define the inputs
symbol = st.text_input("Ticker Symbol").upper()
start_date = st.date_input("Start Date", value=pd.to_datetime("today").floor("D") - pd.offsets.DateOffset(years=10))
end_date = st.date_input("End Date", value=pd.to_datetime("today").floor("D"))

# Define the button to retrieve the data
if st.button("Get Data"):
    data = get_ticker_data(symbol, start_date, end_date)
    st.write(data)
# store data in session
    st.session_state.data = data
Clicking the Save Data button will add the data to TiDB and clear the session.
# Define the button to save the data to TiDB
if st.button("Save Data"):
    if st.session_state.get("data") is None:
        st.write("No data to save.")
        return
    data = st.session_state.data
    save_data(data, symbol)
    del st.session_state['data']
Visualizing trade data
The Visualize Trade Data page lets users enter two stock ticker symbols, a start date, and an end date. When users click Visualize, the app fetches historical trade data for the specified stocks within the given date range and plots a 3D line chart of the dividend paid versus the volume traded for each stock.
# Create two text boxes for entering the stock symbols
symbol1 = st.text_input("Enter Ticker Symbol").upper()
symbol2 = st.text_input("Enter Ticker Symbol to Compare").upper()

# Create two date pickers for selecting the start and end dates
start_date = st.date_input("Start Date", value=pd.to_datetime("today").floor("D") - pd.offsets.DateOffset(years=10))
end_date = st.date_input("End Date", value=pd.to_datetime("today").floor("D"))

if st.button("Visualize"):
    # Fetch data from the database
    data = fetch_data(symbol1, symbol2, start_date, end_date)

    if data.empty:
        st.warning('No data found for the selected criteria. Please adjust the inputs.')
    else:
        # Display the chart
        plot_3d_line(data)
Plot 3D Chart
The plot_3d_line function uses the Plotly library to create the 3D line chart. This library offers a variety of interactive visualization tools that can make data more meaningful. By visualizing the relationship between the dividend paid, volume traded, and year for each stock ticker, users can gain insights into the stocks’ performance over time and make more informed investment decisions.
def plot_3d_line(data):
    fig = px.line_3d(data, x='Year', y='Total_Dividends', z='Avg_Volume', color='Ticker')
    fig.update_layout(title=f"Dividend Paid Vs Volume Traded", height=600, width=800, scene=dict(xaxis_title="Year", yaxis_title="Dividends Paid", zaxis_title="Volume Traded"))
    st.plotly_chart(fig)
Conclusion
Building a stock data analysis app using Python and Streamlit can be a powerful tool for visualizing and analyzing financial data. In addition, using TiDB as the backend database can provide horizontal scalability and high availability for the application.
By following the steps outlined in this blog post, you can create an end-to-end trading data analysis app that collects data, saves it to TiDB Cloud, and visualizes it in a way that can provide insights into trading trends and patterns. If you have any questions or feedback, please feel free to contact us through Twitter, LinkedIn, or our Slack Channel.
Spin up a database with 25 GiB free resources.


TiDB Cloud Dedicated
A fully-managed cloud DBaaS for predictable workloads
TiDB Cloud Starter
A fully-managed cloud DBaaS for auto-scaling workloads